Qt Quick 2 Multiple Graphs Example
Showing multiple graphs simultaneously in a QML application.
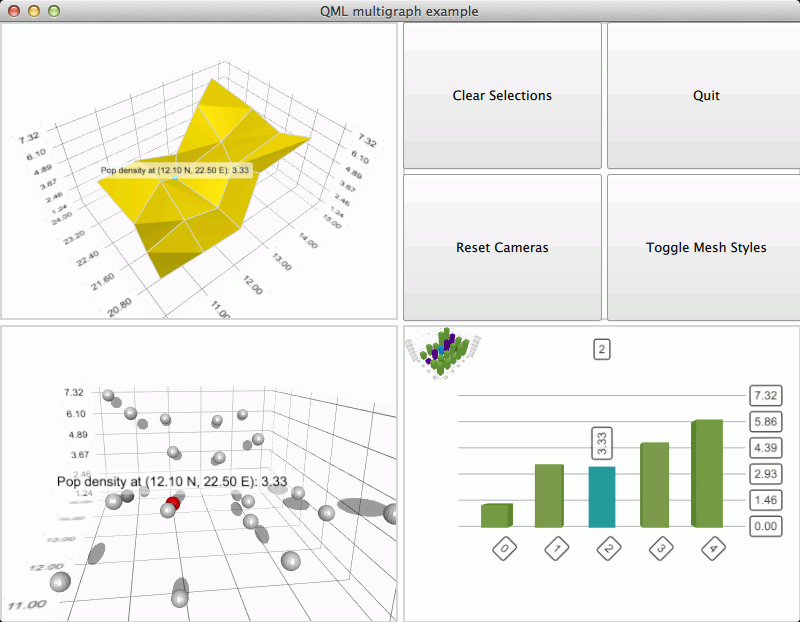
The Qt Quick 2 multiple graphs example demonstrates using multiple graphs in single window.
The interesting thing about this example is demonstrating that multiple graphs can be used simultaneously, so most functionality is not explained in detail. For more detailed QML example documentation, see Qt Quick 2 Scatter Example.
Running the Example
To run the example from Qt Creator, open the Welcome mode and select the example from Examples. For more information, visit Building and Running an Example.
Multiple Graphs
Using multiple graphs in a single application doesn't require anything special, simply define and position the graphs as normal. In this example the graphs are shown in a 2 x 2 grid with GridLayout:
 GridLayout {
     id: gridLayout
     columns: 2
     Layout.fillHeight: true
     Layout.fillWidth: true
     anchors.top: mainView.top
     anchors.bottom: mainView.bottom
     anchors.left: mainView.left
     anchors.right: mainView.right

     Rectangle {
         Layout.fillHeight: true
         Layout.fillWidth: true
         border.color: surfaceGraph.theme.gridLineColor
         border.width: 2

         Surface3D {
             id: surfaceGraph
             anchors.fill: parent
             anchors.margins: parent.border.width
             theme: Theme3D {
                 type: Theme3D.ThemePrimaryColors
                 font.pointSize: 60
             }
             scene.activeCamera.cameraPreset: Camera3D.CameraPresetIsometricLeftHigh

             Surface3DSeries {
                 itemLabelFormat: "Pop density at (@xLabel N, @zLabel E): @yLabel"
                 ItemModelSurfaceDataProxy {
                     itemModel: data.sharedData
                     // The surface data points are not neatly lined up in rows and columns,
                     // so we define explicit row and column roles.
                     rowRole: "row"
                     columnRole: "col"
                     xPosRole: "latitude"
                     zPosRole: "longitude"
                     yPosRole: "pop_density"
                 }
             }
         }
     }

     // We'll use one grid cell for buttons
     Rectangle {
         Layout.fillHeight: true
         Layout.fillWidth: true

         GridLayout {
             anchors.right: parent.right
             anchors.left: parent.left
             anchors.top: parent.top
             anchors.bottom: parent.bottom
             columns: 2

             NewButton {
                 Layout.minimumWidth: parent.width / 2
                 Layout.fillHeight: true
                 Layout.fillWidth: true
                 text: "Clear Selections"
                 onClicked: clearSelections() // call a helper function to keep button itself simpler
             }

             NewButton {
                 Layout.minimumWidth: parent.width / 2
                 Layout.fillHeight: true
                 Layout.fillWidth: true
                 text: "Quit"
                 onClicked: Qt.quit(0);
             }

             NewButton {
                 Layout.fillHeight: true
                 Layout.fillWidth: true
                 text: "Reset Cameras"
                 onClicked: resetCameras() // call a helper function to keep button itself simpler
             }

             NewButton {
                 Layout.fillHeight: true
                 Layout.fillWidth: true
                 text: "Toggle Mesh Styles"
                 onClicked: toggleMeshStyle() // call a helper function to keep button itself simpler
             }
         }
     }

     Rectangle {
         Layout.fillHeight: true
         Layout.fillWidth: true
         border.color: scatterGraph.theme.gridLineColor
         border.width: 2

         Scatter3D {
             id: scatterGraph
             anchors.fill: parent
             anchors.margins: parent.border.width
             theme: Theme3D {
                 type: Theme3D.ThemeDigia
                 font.pointSize: 60
             }
             scene.activeCamera.cameraPreset: Camera3D.CameraPresetIsometricLeftHigh

             Scatter3DSeries {
                 itemLabelFormat: "Pop density at (@xLabel N, @zLabel E): @yLabel"
                 ItemModelScatterDataProxy {
                     itemModel: data.sharedData
                     // Mapping model roles to scatter series item coordinates.
                     xPosRole: "latitude"
                     zPosRole: "longitude"
                     yPosRole: "pop_density"
                 }
             }
         }
     }

     Rectangle {
         Layout.fillHeight: true
         Layout.fillWidth: true
         border.color: barGraph.theme.gridLineColor
         border.width: 2

         Bars3D {
             id: barGraph
             anchors.fill: parent
             anchors.margins: parent.border.width
             theme: Theme3D {
                 type: Theme3D.ThemeQt
                 font.pointSize: 60
             }
             selectionMode: AbstractGraph3D.SelectionItemAndRow | AbstractGraph3D.SelectionSlice
             scene.activeCamera.cameraPreset: Camera3D.CameraPresetIsometricLeftHigh

             Bar3DSeries {
                 itemLabelFormat: "@seriesName: @valueLabel"
                 name: "Population density"

                 ItemModelBarDataProxy {
                     itemModel: data.sharedData
                     // Mapping model roles to bar series rows, columns, and values.
                     rowRole: "row"
                     columnRole: "col"
                     valueRole: "pop_density"
                 }
             }
         }
     }
 }
Each graph has a parent Rectangle item to provide it with a border.
Note that one of the grid cells is used for buttons in an another GridLayout.