Polar Chart Example
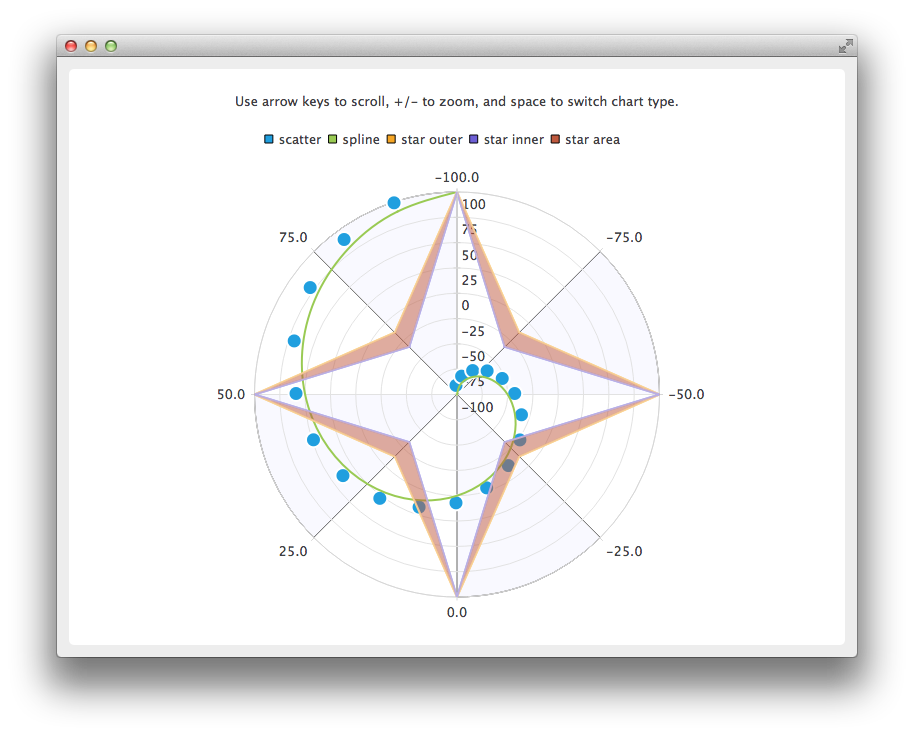
The example shows how to create a simple polar chart with multiple different series.
It also shows how to implement scrolling and zooming of the polar chart as well as visually demonstrate how polar charts and cartesian charts relate to each other.
Running the Example
To run the example from Qt Creator, open the Welcome mode and select the example from Examples. For more information, visit Building and Running an Example.
Creating Polar Charts
Creating a polar chart is done with a QPolarChart instance instead of a QChart instance.
QPolarChart *chart = new QPolarChart();
Axes are created similarly to cartesian charts, but when axes are added to the chart, you can use polar orientations instead of alignments.
 QValueAxis *angularAxis = new QValueAxis();
 angularAxis->setTickCount(9); // First and last ticks are co-located on 0/360 angle.
 angularAxis->setLabelFormat("%.1f");
 angularAxis->setShadesVisible(true);
 angularAxis->setShadesBrush(QBrush(QColor(249, 249, 255)));
 chart->addAxis(angularAxis, QPolarChart::PolarOrientationAngular);

 QValueAxis *radialAxis = new QValueAxis();
 radialAxis->setTickCount(9);
 radialAxis->setLabelFormat("%d");
 chart->addAxis(radialAxis, QPolarChart::PolarOrientationRadial);
Zooming and scrolling of a polar chart is logically nearly identical to zooming and scrolling of a cartesian chart. The main difference is that when scrolling along the X-axis (angular axis), the angle is used instead of the number of pixels. Another difference is that zooming to a rectangle cannot be done.
 void ChartView::keyPressEvent(QKeyEvent *event)
 {
     switch (event->key()) {
     case Qt::Key_Plus:
         chart()->zoomIn();
         break;
     case Qt::Key_Minus:
         chart()->zoomOut();
         break;
     case Qt::Key_Left:
         chart()->scroll(-1.0, 0);
         break;
     case Qt::Key_Right:
         chart()->scroll(1.0, 0);
         break;
     case Qt::Key_Up:
         chart()->scroll(0, 1.0);
         break;
     case Qt::Key_Down:
         chart()->scroll(0, -1.0);
         break;
     case Qt::Key_Space:
         switchChartType();
         break;
     default:
         QGraphicsView::keyPressEvent(event);
         break;
     }
 }
The same axes and series can be used in both cartesian and polar charts, though not simultaneously. To switch between chart types, you first need to remove the series and axes from the old chart, and then add them to the new chart. If you want to preserve the axis ranges, those need to be copied, too.
 void ChartView::switchChartType()
 {
     QChart *newChart;
     QChart *oldChart = chart();

     if (oldChart->chartType() == QChart::ChartTypeCartesian)
         newChart = new QPolarChart();
     else
         newChart = new QChart();

     // Move series and axes from old chart to new one
     const QList<QAbstractSeries *> seriesList = oldChart->series();
     const QList<QAbstractAxis *> axisList = oldChart->axes();
     QList<QPair<qreal, qreal> > axisRanges;

     for (QAbstractAxis *axis : axisList) {
         QValueAxis *valueAxis = static_cast<QValueAxis *>(axis);
         axisRanges.append(QPair<qreal, qreal>(valueAxis->min(), valueAxis->max()));
     }

     for (QAbstractSeries *series : seriesList)
         oldChart->removeSeries(series);

     for (QAbstractAxis *axis : axisList) {
         oldChart->removeAxis(axis);
         newChart->addAxis(axis, axis->alignment());
     }

     for (QAbstractSeries *series : seriesList) {
         newChart->addSeries(series);
         for (QAbstractAxis *axis : axisList)
             series->attachAxis(axis);
     }

     int count = 0;
     for (QAbstractAxis *axis : axisList) {
         axis->setRange(axisRanges[count].first, axisRanges[count].second);
         count++;
     }

     newChart->setTitle(oldChart->title());
     setChart(newChart);
     delete oldChart;
 }