Qml Customizations
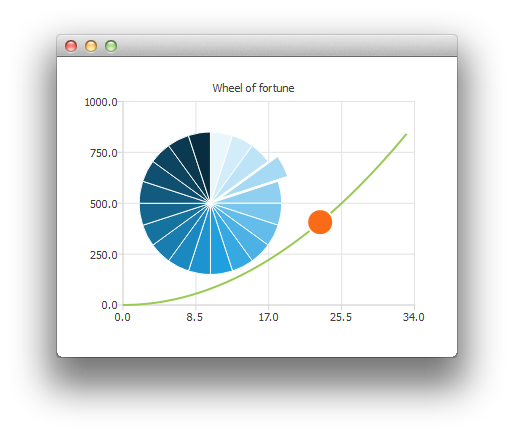
This application shows you how to customize different visual properties of a ChartView and series.

This example shows a wheel of fortune by customizing a pie series.
Running the Example
To run the example from Qt Creator, open the Welcome mode and select the example from Examples. For more information, visit Building and Running an Example.
Customizing Chart Views
First we create the ChartView and a couple of series.
 ChartView {
     id: chartView
     anchors.fill: parent
     title: "Wheel of fortune"
     legend.visible: false
     antialiasing: true

     PieSeries {
         id: wheelOfFortune
         horizontalPosition: 0.3
     }

     SplineSeries {
         id: splineSeries
     }

     ScatterSeries {
         id: scatterSeries
     }
 }
The application data is generated in Component.onCompleted of the main rectangle:
 Component.onCompleted: {
     __intervalCoefficient = Math.random() + 0.25;

     for (var i = 0; i < 20; i++)
         wheelOfFortune.append("", 1);

     var interval = 1;
     for (var j = 0; interval < 800; j++) {
         interval = __intervalCoefficient * j * j;
         splineSeries.append(j, interval);
     }
     chartView.axisX(scatterSeries).max = j;
     chartView.axisY(scatterSeries).max = 1000;
 }
The following customizations are done repeatedly with a timer. To highlight one of the pie slices at time we modify its exploded property:
 wheelOfFortune.at(index).exploded = false;
 __activeIndex++;
 index = __activeIndex % wheelOfFortune.count;
 wheelOfFortune.at(index).exploded = true;
Then an animation using a scatter series with one data point:
 scatterSeries.clear();
 scatterSeries.append(__activeIndex, interval);
 scatterSeries.color = Qt.tint(scatterSeries.color, "#05FF0000");
 scatterSeries.markerSize += 0.5;
When the wheel of fortune has stopped, we make the active slice blink by modifying its colors.
 // Switch the colors of the slice and the border
 wheelOfFortune.at(index).borderWidth = 2;
 switchColor = wheelOfFortune.at(index).borderColor;
 wheelOfFortune.at(index).borderColor = wheelOfFortune.at(index).color;
 wheelOfFortune.at(index).color = switchColor;