Callout Example
This example shows how to draw an additional element (a callout) on top of the chart.
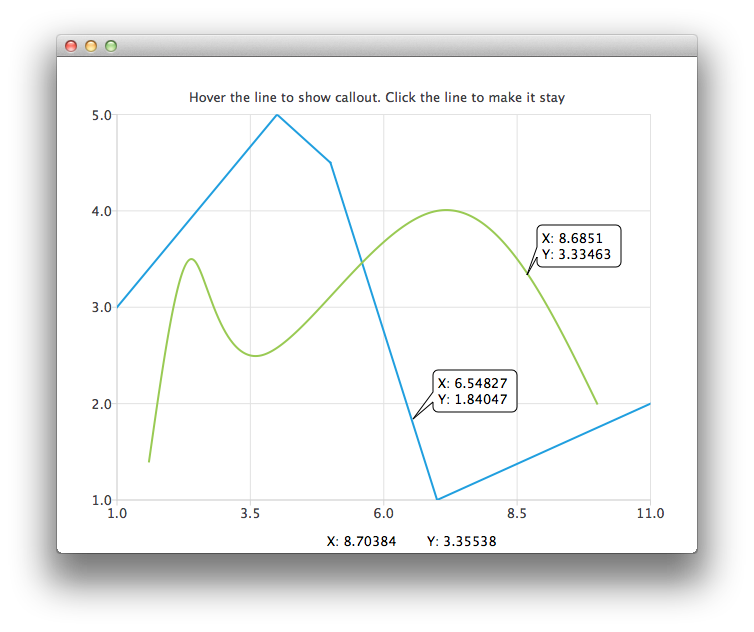
QChart class provides two methods that map between the scene coordinates and the series domain (defined by the axes ranges).
QPointF QChart::mapToPosition(const QPointF &value, QAbstractSeries *series)
QPointF QChart::mapToValue(const QPointF &position, QAbstractSeries *series)
Running the Example
To run the example from Qt Creator, open the Welcome mode and select the example from Examples. For more information, visit Building and Running an Example.