ScatterSeries QML Type
The ScatterSeries type presents data in scatter charts. More...
| Import Statement: | import QtCharts 2.15 |
| Instantiates: | QScatterSeries |
| Inherits: |
Properties
- borderColor : color
- borderWidth : real
- brush : brush
- brushFilename : string
- count : int
- markerShape : enumeration
- markerSize : real
Detailed Description
The scatter data is displayed as a collection of points on the chart. For each point, two values are specified that determine its position on the horizontal axis and the vertical axis.
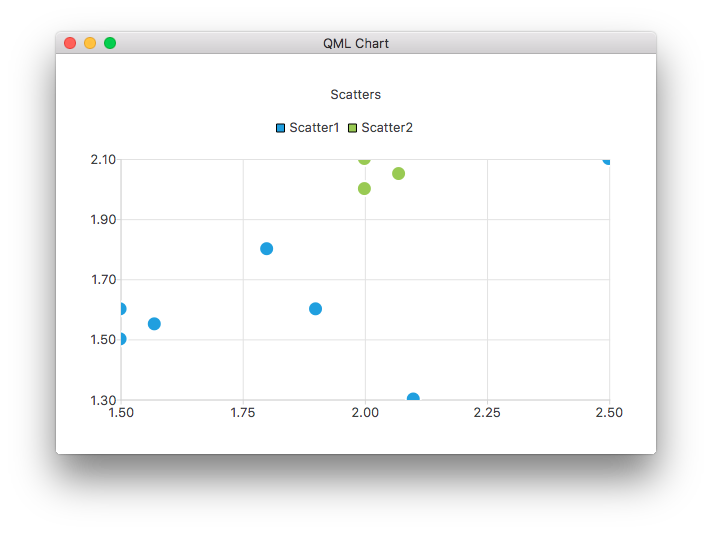
The following QML code shows how to create a chart with two simple scatter series:
 ChartView {
     title: "Scatters"
     anchors.fill: parent
     antialiasing: true

     ScatterSeries {
         id: scatter1
         name: "Scatter1"
         XYPoint { x: 1.5; y: 1.5 }
         XYPoint { x: 1.5; y: 1.6 }
         XYPoint { x: 1.57; y: 1.55 }
         XYPoint { x: 1.8; y: 1.8 }
         XYPoint { x: 1.9; y: 1.6 }
         XYPoint { x: 2.1; y: 1.3 }
         XYPoint { x: 2.5; y: 2.1 }
     }

     ScatterSeries {
         name: "Scatter2"
For more information, see Qml Charts Example.
Property Documentation
The shape used when rendering marker items:
| Constant | Description |
|---|---|
ScatterSeries.MarkerShapeCircle | The marker is a circle. This is the default value. |
ScatterSeries.MarkerShapeRectangle | The marker is a rectangle. |
The size of the marker used to render the points in the series. The default size is 15.0.