Inpainting missing data
Missing data in an image can be an issue, especially when one wants to perform Fourier analysis. This tutorial explains how to fill-up missing pixels with values which looks “realistic” and introduce as little perturbation as possible for subsequent analysis. The user should keep the mask nearby and only consider the values of actual pixels and never the one inpainted.
This tutorial will use fully synthetic data to allow comparison between actual (syntetic) data with inpainted values.
The first part of the tutorial is about the generation of a challenging 2D diffraction image with realistic noise and to describe the metric used, then comes the actual tutorial on how to use the inpainting. Finally a benchmark is used based on the metric determined.
Creation of the image
A realistic challenging image should contain:
Bragg peak rings. We chose LaB6 as guinea-pig, with very sharp peaks, at the limit of the resolution of the detector
Some amorphous content
strong polarization effect
Poissonian noise
One image will be generated but then multiple ones with different noise to discriminate the effect of the noise from other effects.
[1]:
%matplotlib inline
from matplotlib.pyplot import subplots
import numpy
[2]:
import pyFAI
print("Using pyFAI version: ", pyFAI.version)
from pyFAI.azimuthalIntegrator import AzimuthalIntegrator
from pyFAI.gui import jupyter
import pyFAI.test.utilstest
from pyFAI.calibrant import get_calibrant
import time
start_time = time.perf_counter()
Using pyFAI version: 0.20.0-beta1
[3]:
detector = pyFAI.detector_factory("Pilatus2MCdTe")
mask = detector.mask.copy()
nomask = numpy.zeros_like(mask)
detector.mask=nomask
ai = AzimuthalIntegrator(detector=detector)
ai.setFit2D(200, 200, 200)
ai.wavelength = 3e-11
print(ai)
Detector Pilatus CdTe 2M         PixelSize= 1.720e-04, 1.720e-04 m
Wavelength= 3.000000e-11m
SampleDetDist= 2.000000e-01m    PONI= 3.440000e-02, 3.440000e-02m       rot1=0.000000  rot2= 0.000000  rot3= 0.000000 rad
DirectBeamDist= 200.000mm       Center: x=200.000, y=200.000 pix        Tilt=0.000 deg  tiltPlanRotation= 0.000 deg
[4]:
LaB6 = get_calibrant("LaB6")
LaB6.wavelength = ai.wavelength
print(LaB6)
r = ai.array_from_unit(unit="q_nm^-1")
decay_b = numpy.exp(-(r-50)**2/2000)
bragg = LaB6.fake_calibration_image(ai, Imax=1e4, W=1e-6) * ai.polarization(factor=1.0) * decay_b
decay_a = numpy.exp(-r/100)
amorphous = 1000*ai.polarization(factor=1.0)*ai.solidAngleArray() * decay_a
img_nomask = bragg + amorphous
#Not the same noise function for all images two images
img_nomask = numpy.random.poisson(img_nomask)
img_nomask2 = numpy.random.poisson(img_nomask)
img = numpy.random.poisson(img_nomask)
img[numpy.where(mask)] = -1
fig,ax = subplots(1,2, figsize=(10,5))
jupyter.display(img=img, label="With mask", ax=ax[0])
jupyter.display(img=img_nomask, label="Without mask", ax=ax[1])
LaB6 Calibrant with 640 reflections at wavelength 3e-11
[4]:
<AxesSubplot:title={'center':'Without mask'}>
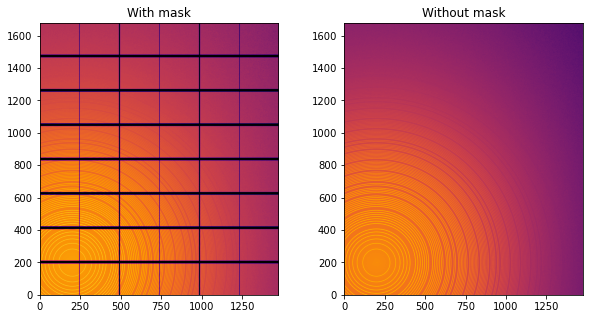
Note the aliassing effect on the displayed images.
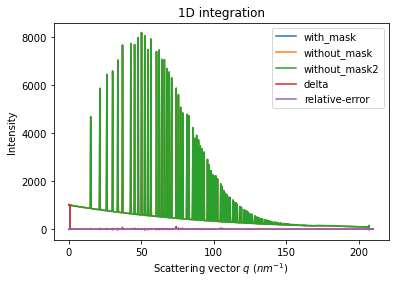
We will measure now the effect after 1D intergeration. We do not correct for polarization on purpose to highlight the defect one wishes to whipe out. We use a R-factor to describe the quality of the 1D-integrated signal.
[5]:
wo = ai.integrate1d(img_nomask, 2000, unit="q_nm^-1", method="splitpixel", radial_range=(0,210))
wo2 = ai.integrate1d(img_nomask2, 2000, unit="q_nm^-1", method="splitpixel", radial_range=(0,210))
wm = ai.integrate1d(img, 2000, unit="q_nm^-1", method="splitpixel", mask=mask, radial_range=(0,210))
ax = jupyter.plot1d(wm , label="with_mask")
ax.plot(*wo, label="without_mask")
ax.plot(*wo2, label="without_mask2")
ax.plot(wo.radial, wo.intensity-wm.intensity, label="delta")
ax.plot(wo.radial, wo.intensity-wo2.intensity, label="relative-error")
ax.legend()
print("Between masked and non masked image R= %s"%pyFAI.utils.mathutil.rwp(wm,wo))
print("Between two different non-masked images R'= %s"%pyFAI.utils.mathutil.rwp(wo2,wo))
Between masked and non masked image R= 5.67619048065858
Between two different non-masked images R'= 0.41080914159883125
[6]:
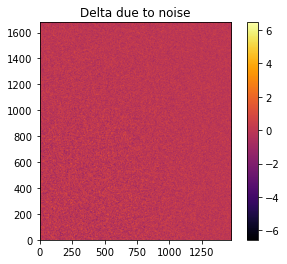
# Effect of the noise on the delta image
fig, ax = subplots()
jupyter.display(img=img_nomask-img_nomask2, label="Delta due to noise", ax=ax)
ax.figure.colorbar(ax.images[0])
[6]:
<matplotlib.colorbar.Colorbar at 0x7fcba4ea0460>
Inpainting
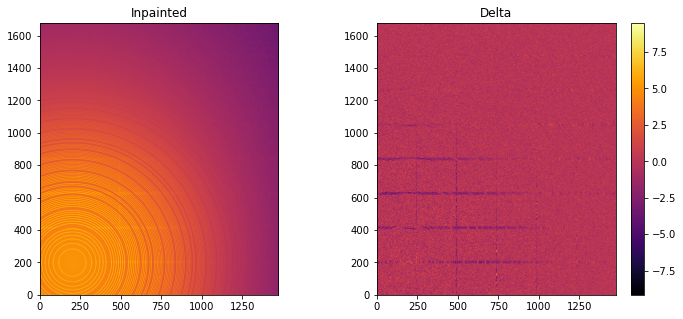
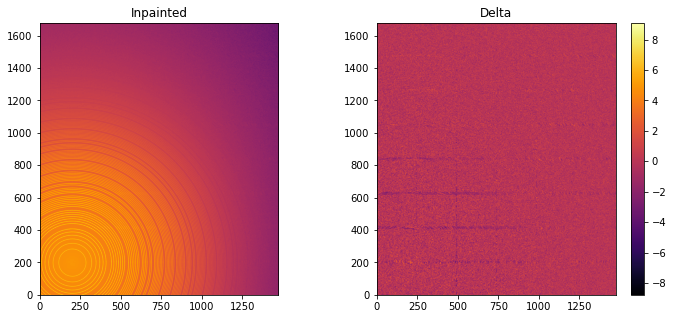
This part describes how to paint the missing pixels for having a “natural-looking image”. The delta image contains the difference with the original image
[7]:
#Inpainting:
inpainted = ai.inpainting(img, mask=mask, poissonian=True)
fig, ax = subplots(1, 2, figsize=(12,5))
jupyter.display(img=inpainted, label="Inpainted", ax=ax[0])
jupyter.display(img=img_nomask-inpainted, label="Delta", ax=ax[1])
ax[1].figure.colorbar(ax[1].images[0])
WARNING:pyFAI.DEPRECATION:Function integrate2d_legacy is deprecated since pyFAI version 0.20.
  File "/usr/lib/python3/dist-packages/pyFAI/azimuthalIntegrator.py", line 3337, in inpainting
    imgb = self.integrate2d(blank_data, **kwargs)
WARNING:pyFAI.DEPRECATION:Function integrate2d_legacy is deprecated since pyFAI version 0.20.
  File "/usr/lib/python3/dist-packages/pyFAI/azimuthalIntegrator.py", line 3338, in inpainting
    imgp = self.integrate2d(masked, **kwargs)
WARNING:pyFAI.DEPRECATION:Function integrate2d_legacy is deprecated since pyFAI version 0.20.
  File "/usr/lib/python3/dist-packages/pyFAI/azimuthalIntegrator.py", line 3339, in inpainting
    imgd = self.integrate2d(masked_data, **kwargs)
[7]:
<matplotlib.colorbar.Colorbar at 0x7fcba4d8e610>
[8]:
# Comparison of the inpained image with the original one:
wm = ai.integrate1d(inpainted, 2000, unit="q_nm^-1", method="splitpixel", radial_range=(0,210))
wo = ai.integrate1d(img_nomask, 2000, unit="q_nm^-1", method="splitpixel", radial_range=(0,210))
ax = jupyter.plot1d(wm , label="inpainted")
ax.plot(*wo, label="without_mask")
ax.plot(wo.radial, wo.intensity-wm.intensity, label="delta")
ax.legend()
print("R= %s"%pyFAI.utils.mathutil.rwp(wm,wo))
R= 1.300831240300783
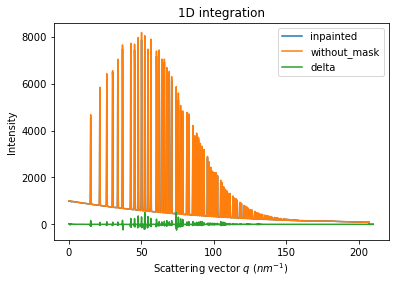
One can see by zooming in that the main effect on inpainting is a broadening of the signal in the inpainted region. This could (partially) be adressed by increasing the number of radial bins used in the inpainting.
Benchmarking and optimization of the parameters
The parameter set depends on the detector, the experiment geometry and the type of signal on the detector. Finer detail require finer slicing.
[9]:
#Basic benchmarking of execution time for default options:
%timeit inpainted = ai.inpainting(img, mask=mask)
567 ms ± 6.63 ms per loop (mean ± std. dev. of 7 runs, 1 loop each)
[10]:
wo = ai.integrate1d(img_nomask, 2000, unit="q_nm^-1", method="splitpixel", radial_range=(0,210))
for m in (("no", "histogram", "cython"), ("bbox", "histogram","cython")):
    for k in (512, 1024, 2048, 4096):
        ai.reset()
        for i in (0, 1, 2, 4, 8):
            inpainted = ai.inpainting(img, mask=mask, poissonian=True, method=m, npt_rad=k, grow_mask=i)
            wm = ai.integrate1d(inpainted, 2000, unit="q_nm^-1", method="splitpixel", radial_range=(0,210))
            print(f"method: {m} npt_rad={k} grow={i}; R= {pyFAI.utils.mathutil.rwp(wm,wo)}")
method: ('no', 'histogram', 'cython') npt_rad=512 grow=0; R= 5.783646212437001
method: ('no', 'histogram', 'cython') npt_rad=512 grow=1; R= 4.237428507810049
method: ('no', 'histogram', 'cython') npt_rad=512 grow=2; R= 3.3029688910321684
method: ('no', 'histogram', 'cython') npt_rad=512 grow=4; R= 2.7783385810118992
method: ('no', 'histogram', 'cython') npt_rad=512 grow=8; R= 2.6306022206436506
method: ('no', 'histogram', 'cython') npt_rad=1024 grow=0; R= 6.719261987025427
method: ('no', 'histogram', 'cython') npt_rad=1024 grow=1; R= 4.486684252027234
method: ('no', 'histogram', 'cython') npt_rad=1024 grow=2; R= 3.4706413367375366
method: ('no', 'histogram', 'cython') npt_rad=1024 grow=4; R= 2.40560101308961
method: ('no', 'histogram', 'cython') npt_rad=1024 grow=8; R= 1.9210807002114292
method: ('no', 'histogram', 'cython') npt_rad=2048 grow=0; R= 6.920722622332915
method: ('no', 'histogram', 'cython') npt_rad=2048 grow=1; R= 5.168512546847185
method: ('no', 'histogram', 'cython') npt_rad=2048 grow=2; R= 4.307174504462693
method: ('no', 'histogram', 'cython') npt_rad=2048 grow=4; R= 3.4484608720859415
method: ('no', 'histogram', 'cython') npt_rad=2048 grow=8; R= 2.4187187699583896
method: ('no', 'histogram', 'cython') npt_rad=4096 grow=0; R= 7.344803605571649
method: ('no', 'histogram', 'cython') npt_rad=4096 grow=1; R= 6.120948805954736
method: ('no', 'histogram', 'cython') npt_rad=4096 grow=2; R= 5.610254424810892
method: ('no', 'histogram', 'cython') npt_rad=4096 grow=4; R= 4.902106689806472
method: ('no', 'histogram', 'cython') npt_rad=4096 grow=8; R= 4.1126548855357825
method: ('bbox', 'histogram', 'cython') npt_rad=512 grow=0; R= 3.134436987121642
method: ('bbox', 'histogram', 'cython') npt_rad=512 grow=1; R= 2.876984824558108
method: ('bbox', 'histogram', 'cython') npt_rad=512 grow=2; R= 2.6913033310354684
method: ('bbox', 'histogram', 'cython') npt_rad=512 grow=4; R= 2.5932260403841925
method: ('bbox', 'histogram', 'cython') npt_rad=512 grow=8; R= 2.524550894214923
method: ('bbox', 'histogram', 'cython') npt_rad=1024 grow=0; R= 1.7694380351042167
method: ('bbox', 'histogram', 'cython') npt_rad=1024 grow=1; R= 1.3026006224658728
method: ('bbox', 'histogram', 'cython') npt_rad=1024 grow=2; R= 1.2882825350585512
method: ('bbox', 'histogram', 'cython') npt_rad=1024 grow=4; R= 1.2439587351436678
method: ('bbox', 'histogram', 'cython') npt_rad=1024 grow=8; R= 1.251751027038632
method: ('bbox', 'histogram', 'cython') npt_rad=2048 grow=0; R= 0.9860431044162915
method: ('bbox', 'histogram', 'cython') npt_rad=2048 grow=1; R= 0.6734717201367353
method: ('bbox', 'histogram', 'cython') npt_rad=2048 grow=2; R= 0.6559786973880258
method: ('bbox', 'histogram', 'cython') npt_rad=2048 grow=4; R= 0.6582179909274324
method: ('bbox', 'histogram', 'cython') npt_rad=2048 grow=8; R= 0.6564926346533908
method: ('bbox', 'histogram', 'cython') npt_rad=4096 grow=0; R= 0.6240546311549537
method: ('bbox', 'histogram', 'cython') npt_rad=4096 grow=1; R= 0.4468049678117388
method: ('bbox', 'histogram', 'cython') npt_rad=4096 grow=2; R= 0.44903665876238297
method: ('bbox', 'histogram', 'cython') npt_rad=4096 grow=4; R= 0.4538928456601852
method: ('bbox', 'histogram', 'cython') npt_rad=4096 grow=8; R= 0.4488140062920467
[11]:
#Inpainting, best solution found:
ai.reset()
%time inpainted = ai.inpainting(img, mask=mask, poissonian=True, method=("pseudo", "csr", "cython"), npt_rad=4096, grow_mask=1)
fig, ax = subplots(1, 2, figsize=(12, 5))
jupyter.display(img=inpainted, label="Inpainted", ax=ax[0])
jupyter.display(img=img_nomask-inpainted, label="Delta", ax=ax[1])
ax[1].figure.colorbar(ax[1].images[0])
pass
CPU times: user 2.47 s, sys: 46.4 ms, total: 2.51 s
Wall time: 1.17 s
[12]:
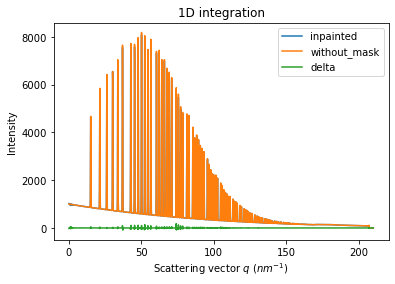
# Comparison of the inpained image with the original one:
wm = ai.integrate1d(inpainted, 2000, unit="q_nm^-1", method="splitpixel", radial_range=(0,210))
wo = ai.integrate1d(img_nomask, 2000, unit="q_nm^-1", method="splitpixel", radial_range=(0,210))
ax = jupyter.plot1d(wm , label="inpainted")
ax.plot(*wo, label="without_mask")
ax.plot(wo.radial, wo.intensity-wm.intensity, label="delta")
ax.legend()
print("R= %s"%pyFAI.utils.mathutil.rwp(wm,wo))
R= 0.44490495766953164
Conclusion
Inpainting is one of the only solution to fill up the gaps in detector when Fourier analysis is needed. This tutorial explains basically how this is possible using the pyFAI library and how to optimize the parameter set for inpainting. The result may greatly vary with detector position and tilt and the kind of signal (amorphous or more spotty).
[13]:
print(f"Execution time: {time.perf_counter()-start_time:.3f} s")
Execution time: 58.908 s