Note
Click here to download the full example code
Rgraph
An example showing how to use the JavaScript InfoVis Toolkit (JIT) JSON export
See the JIT documentation and examples at http://thejit.org

Out:
[
    {
        "id": "one",
        "name": "one",
        "data": {
            "type": "normal"
        },
        "adjacencies": [
            {
                "nodeTo": "two",
                "data": {}
            }
        ]
    },
    {
        "id": "two",
        "name": "two",
        "data": {
            "type": "special"
        },
        "adjacencies": [
            {
                "nodeTo": "one",
                "data": {}
            },
            {
                "nodeTo": 3,
                "data": {
                    "type": "extra special"
                }
            }
        ]
    },
    {
        "id": "solo",
        "name": "solo",
        "data": {}
    },
    {
        "id": 3,
        "name": 3,
        "data": {},
        "adjacencies": [
            {
                "nodeTo": "two",
                "data": {
                    "type": "extra special"
                }
            }
        ]
    }
]
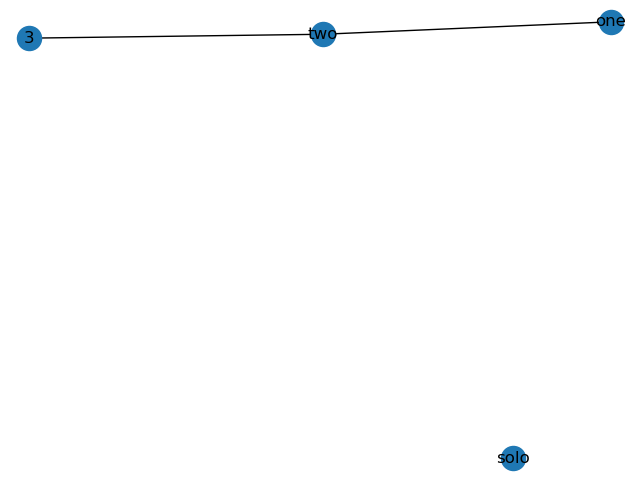
Nodes: [('one', {'type': 'normal'}), ('two', {'type': 'special'}), (3, {}), ('solo', {})]
Edges: [('one', 'two', {}), ('two', 3, {'type': 'extra special'})]
import json

import matplotlib.pyplot as plt
import networkx as nx
from networkx.readwrite.json_graph import jit_data, jit_graph

# add some nodes to a graph
G = nx.Graph()

G.add_node("one", type="normal")
G.add_node("two", type="special")
G.add_node("solo")

# add edges
G.add_edge("one", "two")
G.add_edge("two", 3, type="extra special")

# convert to JIT JSON
jit_json = jit_data(G, indent=4)
print(jit_json)

X = jit_graph(json.loads(jit_json))
print(f"Nodes: {list(X.nodes(data=True))}")
print(f"Edges: {list(X.edges(data=True))}")

nx.draw(G, with_labels=True)
plt.show()
Total running time of the script: ( 0 minutes 0.097 seconds)