Drawing and Labelling Parallels and Meridians
Most maps include a graticule grid, a reference network of labelled
latitude and longitude lines. Basemap does this with the
drawparallels() and
drawmeridians() instance methods.
The longitude and latitude lines can be labelled where they intersect
the map projection boundary. There are a few exceptions: meridians
and parallels cannot be labelled on maps with
proj set to ortho (orthographic), geos (geostationary),
vandg (van der Grinten) or nsper (near-sided perspective),
and meridians cannot be labelled on maps with
proj set to ortho (orthographic), geos (geostationary),
vandg (van der Grinten), nsper (near-sided perspective),
moll (Mollweide), hammer (Hammer), or sinu
(sinusoidal). This is because the lines can be very close
together where they intersect the boundary on these maps, so that
they really need to be labelled manually on the interior of the plot.
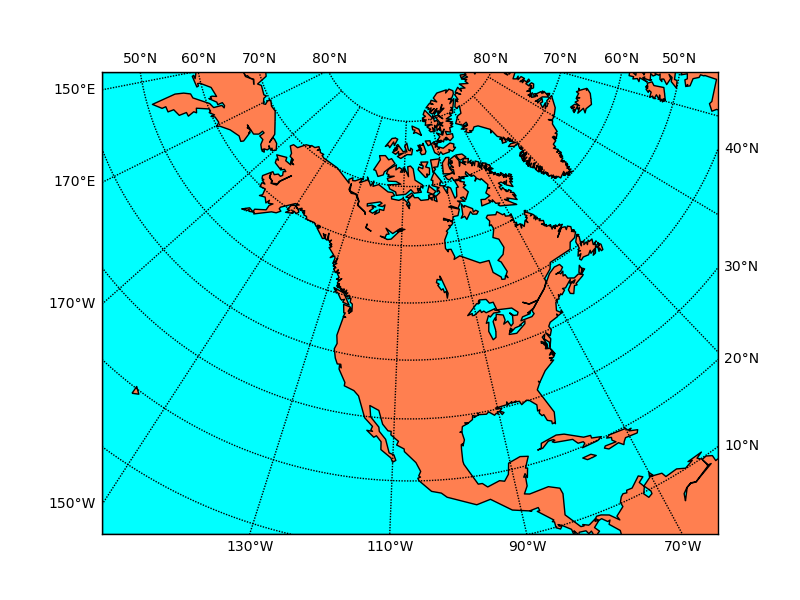
Here’s an example that shows how to draw parallels and meridians
and label them on different sides of the plot.
from mpl_toolkits.basemap import Basemap
import matplotlib.pyplot as plt
import numpy as np
# setup Lambert Conformal basemap.
m = Basemap(width=12000000,height=9000000,projection='lcc',
            resolution='c',lat_1=45.,lat_2=55,lat_0=50,lon_0=-107.)
# draw coastlines.
m.drawcoastlines()
# draw a boundary around the map, fill the background.
# this background will end up being the ocean color, since
# the continents will be drawn on top.
m.drawmapboundary(fill_color='aqua')
# fill continents, set lake color same as ocean color.
m.fillcontinents(color='coral',lake_color='aqua')
# draw parallels and meridians.
# label parallels on right and top
# meridians on bottom and left
parallels = np.arange(0.,81,10.)
# labels = [left,right,top,bottom]
m.drawparallels(parallels,labels=[False,True,True,False])
meridians = np.arange(10.,351.,20.)
m.drawmeridians(meridians,labels=[True,False,False,True])
plt.show()