Plotting data on a map (Example Gallery)
Following are a series of examples that illustrate how to use Basemap instance methods to plot your data on a map. More examples are included in the examples directory of the basemap source distribution. There are a number of Basemap instance methods for plotting data:
contour(): draw contour lines.contourf(): draw filled contours.imshow(): draw an image.pcolor(): draw a pseudocolor plot.pcolormesh(): draw a pseudocolor plot (faster version for regular meshes).plot(): draw lines and/or markers.scatter(): draw points with markers.quiver(): draw vectors.barbs(): draw wind barbs.drawgreatcircle(): draw a great circle.
Many of these instances methods simply forward to the corresponding matplotlib Axes instance method, with some extra pre/post processing and argument checking. You can also plot on the map directly with the matplotlib pyplot interface, or the OO api, using the Axes instance associated with the Basemap.
For more specifics of how to use the Basemap instance methods, see The Matplotlib Basemap Toolkit API.
Here are the examples (many of which utilize the netcdf4-python module to retrieve datasets over http):
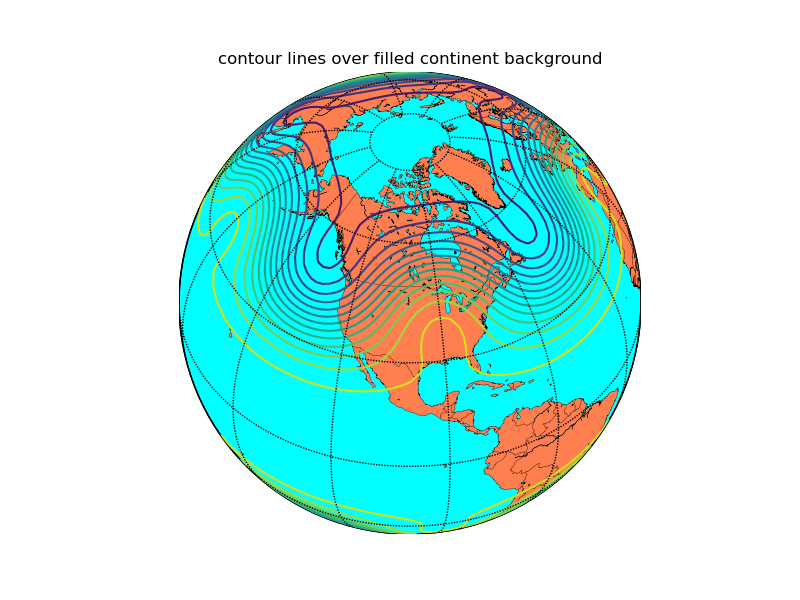
Plot contour lines on a basemap
from mpl_toolkits.basemap import Basemap
import matplotlib.pyplot as plt
import numpy as np
# set up orthographic map projection with
# perspective of satellite looking down at 45N, 100W.
# use low resolution coastlines.
map = Basemap(projection='ortho',lat_0=45,lon_0=-100,resolution='l')
# draw coastlines, country boundaries, fill continents.
map.drawcoastlines(linewidth=0.25)
map.drawcountries(linewidth=0.25)
map.fillcontinents(color='coral',lake_color='aqua')
# draw the edge of the map projection region (the projection limb)
map.drawmapboundary(fill_color='aqua')
# draw lat/lon grid lines every 30 degrees.
map.drawmeridians(np.arange(0,360,30))
map.drawparallels(np.arange(-90,90,30))
# make up some data on a regular lat/lon grid.
nlats = 73; nlons = 145; delta = 2.*np.pi/(nlons-1)
lats = (0.5*np.pi-delta*np.indices((nlats,nlons))[0,:,:])
lons = (delta*np.indices((nlats,nlons))[1,:,:])
wave = 0.75*(np.sin(2.*lats)**8*np.cos(4.*lons))
mean = 0.5*np.cos(2.*lats)*((np.sin(2.*lats))**2 + 2.)
# compute native map projection coordinates of lat/lon grid.
x, y = map(lons*180./np.pi, lats*180./np.pi)
# contour data over the map.
cs = map.contour(x,y,wave+mean,15,linewidths=1.5)
plt.title('contour lines over filled continent background')
plt.show()
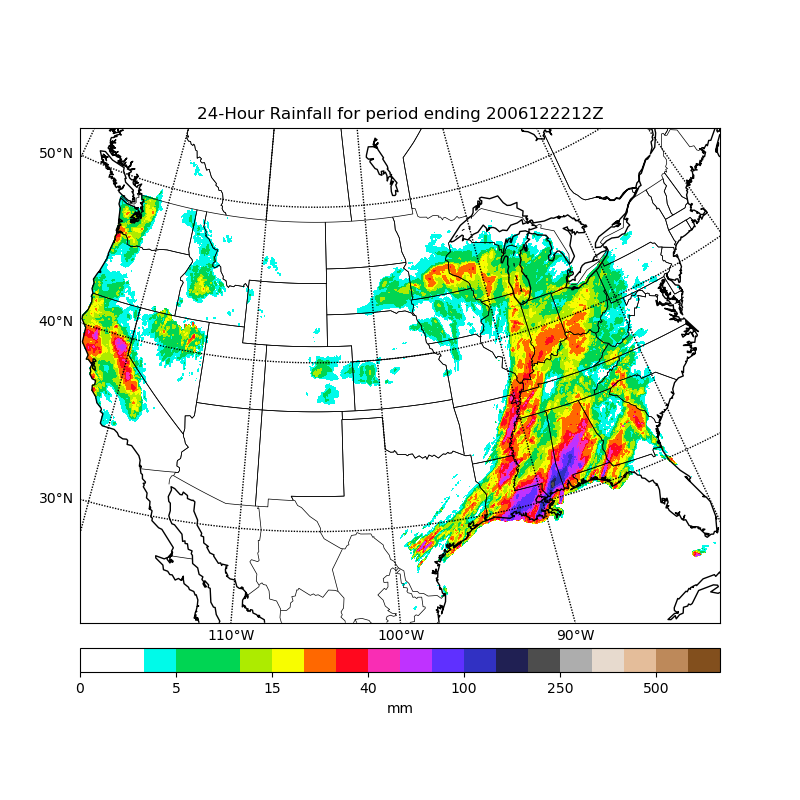
Plot precip with filled contours
from mpl_toolkits.basemap import Basemap, cm
# requires netcdf4-python (netcdf4-python.googlecode.com)
from netCDF4 import Dataset as NetCDFFile
import numpy as np
import matplotlib.pyplot as plt

# plot rainfall from NWS using special precipitation
# colormap used by the NWS, and included in basemap.

nc = NetCDFFile('../../../examples/nws_precip_conus_20061222.nc')
# data from http://water.weather.gov/precip/
prcpvar = nc.variables['amountofprecip']
data = 0.01*prcpvar[:]
latcorners = nc.variables['lat'][:]
loncorners = -nc.variables['lon'][:]
lon_0 = -nc.variables['true_lon'].getValue()
lat_0 = nc.variables['true_lat'].getValue()
# create figure and axes instances
fig = plt.figure(figsize=(8,8))
ax = fig.add_axes([0.1,0.1,0.8,0.8])
# create polar stereographic Basemap instance.
m = Basemap(projection='stere',lon_0=lon_0,lat_0=90.,lat_ts=lat_0,\
            llcrnrlat=latcorners[0],urcrnrlat=latcorners[2],\
            llcrnrlon=loncorners[0],urcrnrlon=loncorners[2],\
            rsphere=6371200.,resolution='l',area_thresh=10000)
# draw coastlines, state and country boundaries, edge of map.
m.drawcoastlines()
m.drawstates()
m.drawcountries()
# draw parallels.
parallels = np.arange(0.,90,10.)
m.drawparallels(parallels,labels=[1,0,0,0],fontsize=10)
# draw meridians
meridians = np.arange(180.,360.,10.)
m.drawmeridians(meridians,labels=[0,0,0,1],fontsize=10)
ny = data.shape[0]; nx = data.shape[1]
lons, lats = m.makegrid(nx, ny) # get lat/lons of ny by nx evenly space grid.
x, y = m(lons, lats) # compute map proj coordinates.
# draw filled contours.
clevs = [0,1,2.5,5,7.5,10,15,20,30,40,50,70,100,150,200,250,300,400,500,600,750]
cs = m.contourf(x,y,data,clevs,cmap=cm.s3pcpn)
# add colorbar.
cbar = m.colorbar(cs,location='bottom',pad="5%")
cbar.set_label('mm')
# add title
plt.title(prcpvar.long_name+' for period ending '+prcpvar.dateofdata)
plt.show()
Plot sea-level pressure weather map with labelled highs and lows
"""
plot H's and L's on a sea-level pressure map
(uses scipy.ndimage.filters and netcdf4-python)
"""
import numpy as np
import matplotlib.pyplot as plt
from datetime import datetime
from mpl_toolkits.basemap import Basemap, addcyclic
from scipy.ndimage.filters import minimum_filter, maximum_filter
from netCDF4 import Dataset

def extrema(mat,mode='wrap',window=10):
    """find the indices of local extrema (min and max)
    in the input array."""
    mn = minimum_filter(mat, size=window, mode=mode)
    mx = maximum_filter(mat, size=window, mode=mode)
    # (mat == mx) true if pixel is equal to the local max
    # (mat == mn) true if pixel is equal to the local in
    # Return the indices of the maxima, minima
    return np.nonzero(mat == mn), np.nonzero(mat == mx)

# plot 00 UTC today.
date = datetime.now().strftime('%Y%m%d')+'00'

# open OpenDAP dataset.
#data=Dataset("http://nomads.ncep.noaa.gov:9090/dods/gfs/gfs/%s/gfs_%sz_anl" %\
#        (date[0:8],date[8:10]))
data=Dataset("http://nomads.ncep.noaa.gov:9090/dods/gfs_hd/gfs_hd%s/gfs_hd_%sz"%\
        (date[0:8],date[8:10]))


# read lats,lons.
lats = data.variables['lat'][:]
lons1 = data.variables['lon'][:]
nlats = len(lats)
nlons = len(lons1)
# read prmsl, convert to hPa (mb).
prmsl = 0.01*data.variables['prmslmsl'][0]
# the window parameter controls the number of highs and lows detected.
# (higher value, fewer highs and lows)
local_min, local_max = extrema(prmsl, mode='wrap', window=50)
# create Basemap instance.
m =\
Basemap(llcrnrlon=0,llcrnrlat=-80,urcrnrlon=360,urcrnrlat=80,projection='mill')
# add wrap-around point in longitude.
prmsl, lons = addcyclic(prmsl, lons1)
# contour levels
clevs = np.arange(900,1100.,5.)
# find x,y of map projection grid.
lons, lats = np.meshgrid(lons, lats)
x, y = m(lons, lats)
# create figure.
fig=plt.figure(figsize=(8,4.5))
ax = fig.add_axes([0.05,0.05,0.9,0.85])
cs = m.contour(x,y,prmsl,clevs,colors='k',linewidths=1.)
m.drawcoastlines(linewidth=1.25)
m.fillcontinents(color='0.8')
m.drawparallels(np.arange(-80,81,20),labels=[1,1,0,0])
m.drawmeridians(np.arange(0,360,60),labels=[0,0,0,1])
xlows = x[local_min]; xhighs = x[local_max]
ylows = y[local_min]; yhighs = y[local_max]
lowvals = prmsl[local_min]; highvals = prmsl[local_max]
# plot lows as blue L's, with min pressure value underneath.
xyplotted = []
# don't plot if there is already a L or H within dmin meters.
yoffset = 0.022*(m.ymax-m.ymin)
dmin = yoffset
for x,y,p in zip(xlows, ylows, lowvals):
    if x < m.xmax and x > m.xmin and y < m.ymax and y > m.ymin:
        dist = [np.sqrt((x-x0)**2+(y-y0)**2) for x0,y0 in xyplotted]
        if not dist or min(dist) > dmin:
            plt.text(x,y,'L',fontsize=14,fontweight='bold',
                    ha='center',va='center',color='b')
            plt.text(x,y-yoffset,repr(int(p)),fontsize=9,
                    ha='center',va='top',color='b',
                    bbox = dict(boxstyle="square",ec='None',fc=(1,1,1,0.5)))
            xyplotted.append((x,y))
# plot highs as red H's, with max pressure value underneath.
xyplotted = []
for x,y,p in zip(xhighs, yhighs, highvals):
    if x < m.xmax and x > m.xmin and y < m.ymax and y > m.ymin:
        dist = [np.sqrt((x-x0)**2+(y-y0)**2) for x0,y0 in xyplotted]
        if not dist or min(dist) > dmin:
            plt.text(x,y,'H',fontsize=14,fontweight='bold',
                    ha='center',va='center',color='r')
            plt.text(x,y-yoffset,repr(int(p)),fontsize=9,
                    ha='center',va='top',color='r',
                    bbox = dict(boxstyle="square",ec='None',fc=(1,1,1,0.5)))
            xyplotted.append((x,y))
plt.title('Mean Sea-Level Pressure (with Highs and Lows) %s' % date)
plt.show()
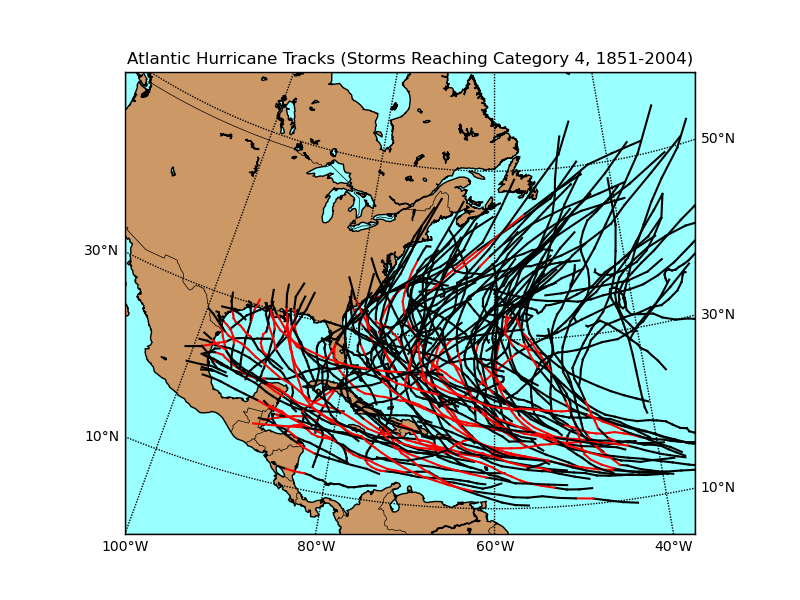
Plot hurricane tracks from a shapefile
"""
draw Atlantic Hurricane Tracks for storms that reached Cat 4 or 5.
part of the track for which storm is cat 4 or 5 is shown red.
ESRI shapefile data from http://nationalatlas.gov/mld/huralll.html
"""
import numpy as np
import matplotlib.pyplot as plt
from mpl_toolkits.basemap import Basemap
# Lambert Conformal Conic map.
m = Basemap(llcrnrlon=-100.,llcrnrlat=0.,urcrnrlon=-20.,urcrnrlat=57.,
            projection='lcc',lat_1=20.,lat_2=40.,lon_0=-60.,
            resolution ='l',area_thresh=1000.)
# read shapefile.
shp_info = m.readshapefile('../../../examples/huralll020','hurrtracks',drawbounds=False)
# find names of storms that reached Cat 4.
names = []
for shapedict in m.hurrtracks_info:
    cat = shapedict['CATEGORY']
    name = shapedict['NAME']
    if cat in ['H4','H5'] and name not in names:
        # only use named storms.
        if name != 'NOT NAMED':  names.append(name)
# plot tracks of those storms.
for shapedict,shape in zip(m.hurrtracks_info,m.hurrtracks):
    name = shapedict['NAME']
    cat = shapedict['CATEGORY']
    if name in names:
        xx,yy = zip(*shape)
        # show part of track where storm > Cat 4 as thick red.
        if cat in ['H4','H5']:
            m.plot(xx,yy,linewidth=1.5,color='r')
        elif cat in ['H1','H2','H3']:
            m.plot(xx,yy,color='k')
# draw coastlines, meridians and parallels.
m.drawcoastlines()
m.drawcountries()
m.drawmapboundary(fill_color='#99ffff')
m.fillcontinents(color='#cc9966',lake_color='#99ffff')
m.drawparallels(np.arange(10,70,20),labels=[1,1,0,0])
m.drawmeridians(np.arange(-100,0,20),labels=[0,0,0,1])
plt.title('Atlantic Hurricane Tracks (Storms Reaching Category 4, 1851-2004)')
plt.show()
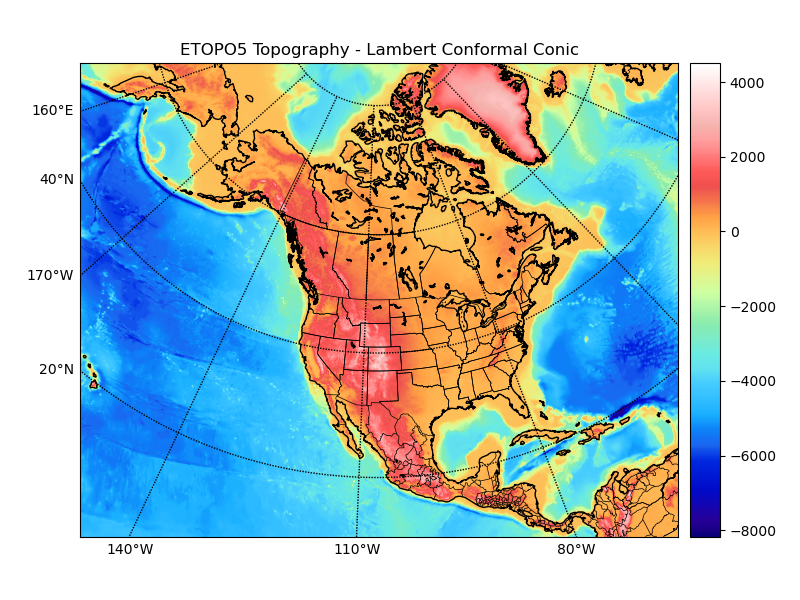
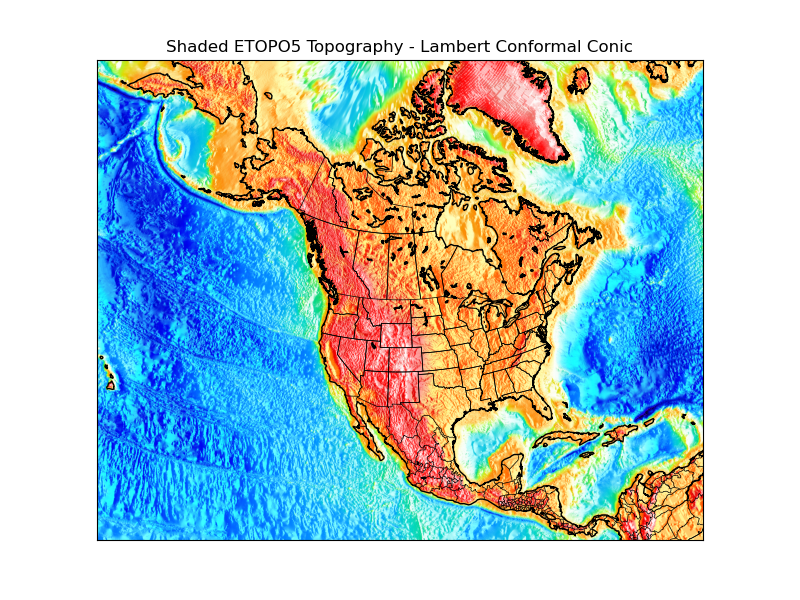
Plot etopo5 topography/bathymetry data as an image (with and without shading from a specified light source).
from mpl_toolkits.basemap import Basemap, shiftgrid, cm
import numpy as np
import matplotlib.pyplot as plt
from netCDF4 import Dataset

# read in etopo5 topography/bathymetry.
url = 'http://ferret.pmel.noaa.gov/thredds/dodsC/data/PMEL/etopo5.nc'
etopodata = Dataset(url)

topoin = etopodata.variables['ROSE'][:]
lons = etopodata.variables['ETOPO05_X'][:]
lats = etopodata.variables['ETOPO05_Y'][:]
# shift data so lons go from -180 to 180 instead of 20 to 380.
topoin,lons = shiftgrid(180.,topoin,lons,start=False)

# plot topography/bathymetry as an image.

# create the figure and axes instances.
fig = plt.figure()
ax = fig.add_axes([0.1,0.1,0.8,0.8])
# setup of basemap ('lcc' = lambert conformal conic).
# use major and minor sphere radii from WGS84 ellipsoid.
m = Basemap(llcrnrlon=-145.5,llcrnrlat=1.,urcrnrlon=-2.566,urcrnrlat=46.352,\
            rsphere=(6378137.00,6356752.3142),\
            resolution='l',area_thresh=1000.,projection='lcc',\
            lat_1=50.,lon_0=-107.,ax=ax)
# transform to nx x ny regularly spaced 5km native projection grid
nx = int((m.xmax-m.xmin)/5000.)+1; ny = int((m.ymax-m.ymin)/5000.)+1
topodat = m.transform_scalar(topoin,lons,lats,nx,ny)
# plot image over map with imshow.
im = m.imshow(topodat,cm.GMT_haxby)
# draw coastlines and political boundaries.
m.drawcoastlines()
m.drawcountries()
m.drawstates()
# draw parallels and meridians.
# label on left and bottom of map.
parallels = np.arange(0.,80,20.)
m.drawparallels(parallels,labels=[1,0,0,1])
meridians = np.arange(10.,360.,30.)
m.drawmeridians(meridians,labels=[1,0,0,1])
# add colorbar
cb = m.colorbar(im,"right", size="5%", pad='2%')
ax.set_title('ETOPO5 Topography - Lambert Conformal Conic')
plt.show()
# make a shaded relief plot.

# create new figure, axes instance.
fig = plt.figure()
ax = fig.add_axes([0.1,0.1,0.8,0.8])
# attach new axes image to existing Basemap instance.
m.ax = ax
# create light source object.
from matplotlib.colors import LightSource
ls = LightSource(azdeg = 90, altdeg = 20)
# convert data to rgb array including shading from light source.
# (must specify color map)
rgb = ls.shade(topodat, cm.GMT_haxby)
im = m.imshow(rgb)
# draw coastlines and political boundaries.
m.drawcoastlines()
m.drawcountries()
m.drawstates()
ax.set_title('Shaded ETOPO5 Topography - Lambert Conformal Conic')
plt.show()
Plot markers at locations of ARGO floats.
from netCDF4 import Dataset, num2date
import time, calendar, datetime, numpy
from mpl_toolkits.basemap import Basemap
import matplotlib.pyplot as plt
import urllib, os
# data downloaded from the form at
# http://coastwatch.pfeg.noaa.gov/erddap/tabledap/apdrcArgoAll.html
filename, headers = urllib.urlretrieve('http://coastwatch.pfeg.noaa.gov/erddap/tabledap/apdrcArgoAll.nc?longitude,latitude,time&longitude>=0&longitude<=360&latitude>=-90&latitude<=90&time>=2010-01-01&time<=2010-01-08&distinct()')
dset = Dataset(filename)
lats = dset.variables['latitude'][:]
lons = dset.variables['longitude'][:]
time = dset.variables['time']
times = time[:]
t1 = times.min(); t2 = times.max()
date1 = num2date(t1, units=time.units)
date2 = num2date(t2, units=time.units)
dset.close()
os.remove(filename)
# draw map with markers for float locations
m = Basemap(projection='hammer',lon_0=180)
x, y = m(lons,lats)
m.drawmapboundary(fill_color='#99ffff')
m.fillcontinents(color='#cc9966',lake_color='#99ffff')
m.scatter(x,y,3,marker='o',color='k')
plt.title('Locations of %s ARGO floats active between %s and %s' %\
        (len(lats),date1,date2),fontsize=12)
plt.show()
Pseudo-color plot of SST and sea ice analysis.
from mpl_toolkits.basemap import Basemap
from netCDF4 import Dataset, date2index
import numpy as np
import matplotlib.pyplot as plt
from datetime import datetime
date = datetime(2007,12,15,0) # date to plot.
# open dataset.
dataset = \
Dataset('http://www.ncdc.noaa.gov/thredds/dodsC/OISST-V2-AVHRR_agg')
timevar = dataset.variables['time']
timeindex = date2index(date,timevar) # find time index for desired date.
# read sst.  Will automatically create a masked array using
# missing_value variable attribute. 'squeeze out' singleton dimensions.
sst = dataset.variables['sst'][timeindex,:].squeeze()
# read ice.
ice = dataset.variables['ice'][timeindex,:].squeeze()
# read lats and lons (representing centers of grid boxes).
lats = dataset.variables['lat'][:]
lons = dataset.variables['lon'][:]
lons, lats = np.meshgrid(lons,lats)
# create figure, axes instances.
fig = plt.figure()
ax = fig.add_axes([0.05,0.05,0.9,0.9])
# create Basemap instance.
# coastlines not used, so resolution set to None to skip
# continent processing (this speeds things up a bit)
m = Basemap(projection='kav7',lon_0=0,resolution=None)
# draw line around map projection limb.
# color background of map projection region.
# missing values over land will show up this color.
m.drawmapboundary(fill_color='0.3')
# plot sst, then ice with pcolor
im1 = m.pcolormesh(lons,lats,sst,shading='flat',cmap=plt.cm.jet,latlon=True)
im2 = m.pcolormesh(lons,lats,ice,shading='flat',cmap=plt.cm.gist_gray,latlon=True)
# draw parallels and meridians, but don't bother labelling them.
m.drawparallels(np.arange(-90.,99.,30.))
m.drawmeridians(np.arange(-180.,180.,60.))
# add colorbar
cb = m.colorbar(im1,"bottom", size="5%", pad="2%")
# add a title.
ax.set_title('SST and ICE analysis for %s'%date)
plt.show()
Plotting wind vectors and wind barbs.
import numpy as np
import matplotlib.pyplot as plt
import datetime
from mpl_toolkits.basemap import Basemap, shiftgrid
from netCDF4 import Dataset
# specify date to plot.
yyyy=1993; mm=03; dd=14; hh=00
date = datetime.datetime(yyyy,mm,dd,hh)
# set OpenDAP server URL.
URLbase="http://nomads.ncdc.noaa.gov/thredds/dodsC/modeldata/cmd_pgbh/"
URL=URLbase+"%04i/%04i%02i/%04i%02i%02i/pgbh00.gdas.%04i%02i%02i%02i.grb2" %\
             (yyyy,yyyy,mm,yyyy,mm,dd,yyyy,mm,dd,hh)
data = Dataset(URL)
# read lats,lons
# reverse latitudes so they go from south to north.
latitudes = data.variables['lat'][::-1]
longitudes = data.variables['lon'][:].tolist()
# get sea level pressure and 10-m wind data.
# mult slp by 0.01 to put in units of hPa.
slpin = 0.01*data.variables['Pressure_msl'][:].squeeze()
uin = data.variables['U-component_of_wind_height_above_ground'][:].squeeze()
vin = data.variables['V-component_of_wind_height_above_ground'][:].squeeze()
# add cyclic points manually (could use addcyclic function)
slp = np.zeros((slpin.shape[0],slpin.shape[1]+1),np.float)
slp[:,0:-1] = slpin[::-1]; slp[:,-1] = slpin[::-1,0]
u = np.zeros((uin.shape[0],uin.shape[1]+1),np.float64)
u[:,0:-1] = uin[::-1]; u[:,-1] = uin[::-1,0]
v = np.zeros((vin.shape[0],vin.shape[1]+1),np.float64)
v[:,0:-1] = vin[::-1]; v[:,-1] = vin[::-1,0]
longitudes.append(360.); longitudes = np.array(longitudes)
# make 2-d grid of lons, lats
lons, lats = np.meshgrid(longitudes,latitudes)
# make orthographic basemap.
m = Basemap(resolution='c',projection='ortho',lat_0=60.,lon_0=-60.)
# create figure, add axes
fig1 = plt.figure(figsize=(8,10))
ax = fig1.add_axes([0.1,0.1,0.8,0.8])
# set desired contour levels.
clevs = np.arange(960,1061,5)
# compute native x,y coordinates of grid.
x, y = m(lons, lats)
# define parallels and meridians to draw.
parallels = np.arange(-80.,90,20.)
meridians = np.arange(0.,360.,20.)
# plot SLP contours.
CS1 = m.contour(x,y,slp,clevs,linewidths=0.5,colors='k',animated=True)
CS2 = m.contourf(x,y,slp,clevs,cmap=plt.cm.RdBu_r,animated=True)
# plot wind vectors on projection grid.
# first, shift grid so it goes from -180 to 180 (instead of 0 to 360
# in longitude).  Otherwise, interpolation is messed up.
ugrid,newlons = shiftgrid(180.,u,longitudes,start=False)
vgrid,newlons = shiftgrid(180.,v,longitudes,start=False)
# transform vectors to projection grid.
uproj,vproj,xx,yy = \
m.transform_vector(ugrid,vgrid,newlons,latitudes,31,31,returnxy=True,masked=True)
# now plot.
Q = m.quiver(xx,yy,uproj,vproj,scale=700)
# make quiver key.
qk = plt.quiverkey(Q, 0.1, 0.1, 20, '20 m/s', labelpos='W')
# draw coastlines, parallels, meridians.
m.drawcoastlines(linewidth=1.5)
m.drawparallels(parallels)
m.drawmeridians(meridians)
# add colorbar
cb = m.colorbar(CS2,"bottom", size="5%", pad="2%")
cb.set_label('hPa')
# set plot title
ax.set_title('SLP and Wind Vectors '+str(date))
plt.show()

# create 2nd figure, add axes
fig2 = plt.figure(figsize=(8,10))
ax = fig2.add_axes([0.1,0.1,0.8,0.8])
# plot SLP contours
CS1 = m.contour(x,y,slp,clevs,linewidths=0.5,colors='k',animated=True)
CS2 = m.contourf(x,y,slp,clevs,cmap=plt.cm.RdBu_r,animated=True)
# plot wind barbs over map.
barbs = m.barbs(xx,yy,uproj,vproj,length=5,barbcolor='k',flagcolor='r',linewidth=0.5)
# draw coastlines, parallels, meridians.
m.drawcoastlines(linewidth=1.5)
m.drawparallels(parallels)
m.drawmeridians(meridians)
# add colorbar
cb = m.colorbar(CS2,"bottom", size="5%", pad="2%")
cb.set_label('hPa')
# set plot title.
ax.set_title('SLP and Wind Barbs '+str(date))
plt.show()
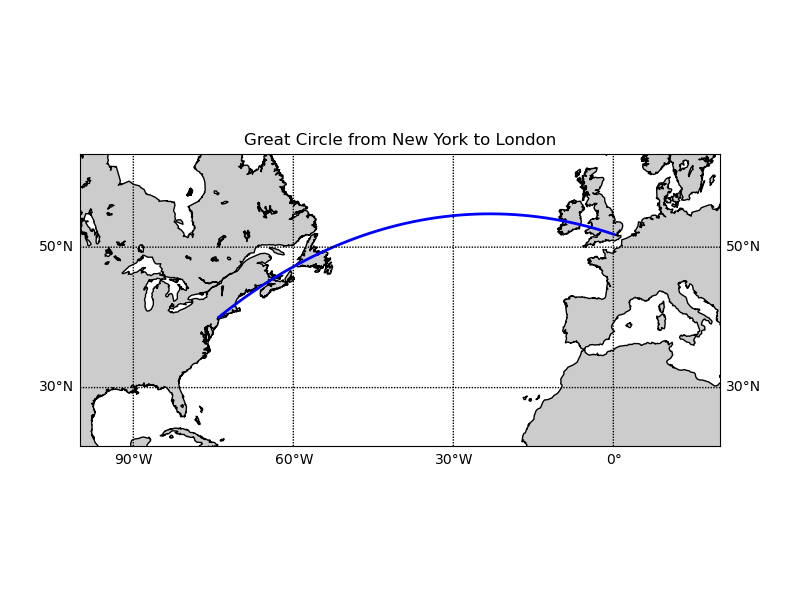
Draw great circle between NY and London.
from mpl_toolkits.basemap import Basemap
import numpy as np
import matplotlib.pyplot as plt
# create new figure, axes instances.
fig=plt.figure()
ax=fig.add_axes([0.1,0.1,0.8,0.8])
# setup mercator map projection.
m = Basemap(llcrnrlon=-100.,llcrnrlat=20.,urcrnrlon=20.,urcrnrlat=60.,\
            rsphere=(6378137.00,6356752.3142),\
            resolution='l',projection='merc',\
            lat_0=40.,lon_0=-20.,lat_ts=20.)
# nylat, nylon are lat/lon of New York
nylat = 40.78; nylon = -73.98
# lonlat, lonlon are lat/lon of London.
lonlat = 51.53; lonlon = 0.08
# draw great circle route between NY and London
m.drawgreatcircle(nylon,nylat,lonlon,lonlat,linewidth=2,color='b')
m.drawcoastlines()
m.fillcontinents()
# draw parallels
m.drawparallels(np.arange(10,90,20),labels=[1,1,0,1])
# draw meridians
m.drawmeridians(np.arange(-180,180,30),labels=[1,1,0,1])
ax.set_title('Great Circle from New York to London')
plt.show()
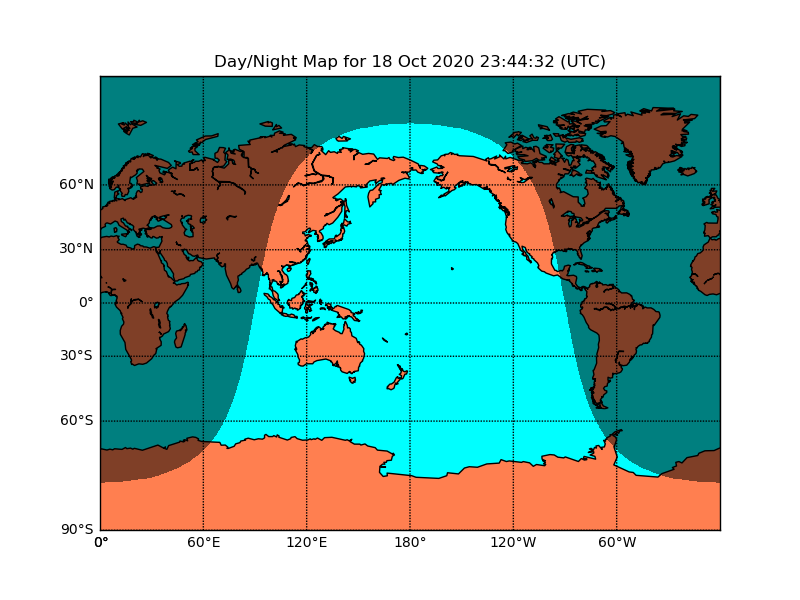
Draw day-night terminator on a map.
import numpy as np
from mpl_toolkits.basemap import Basemap
import matplotlib.pyplot as plt
from datetime import datetime
# miller projection
map = Basemap(projection='mill',lon_0=180)
# plot coastlines, draw label meridians and parallels.
map.drawcoastlines()
map.drawparallels(np.arange(-90,90,30),labels=[1,0,0,0])
map.drawmeridians(np.arange(map.lonmin,map.lonmax+30,60),labels=[0,0,0,1])
# fill continents 'coral' (with zorder=0), color wet areas 'aqua'
map.drawmapboundary(fill_color='aqua')
map.fillcontinents(color='coral',lake_color='aqua')
# shade the night areas, with alpha transparency so the
# map shows through. Use current time in UTC.
date = datetime.utcnow()
CS=map.nightshade(date)
plt.title('Day/Night Map for %s (UTC)' % date.strftime("%d %b %Y %H:%M:%S"))
plt.show()
