Note
Click here to download the full example code
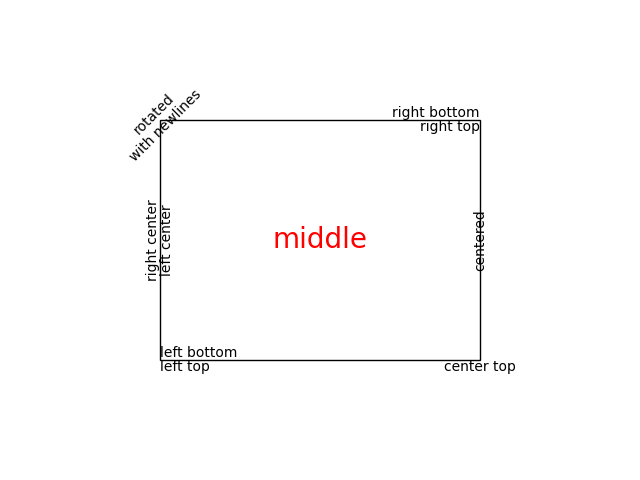
Text Layout
Create text with different alignment and rotation.
import matplotlib.pyplot as plt
import matplotlib.patches as patches

fig = plt.figure()

left, width = .25, .5
bottom, height = .25, .5
right = left + width
top = bottom + height

# Draw a rectangle in figure coordinates ((0, 0) is bottom left and (1, 1) is
# upper right).
p = patches.Rectangle((left, bottom), width, height, fill=False)
fig.add_artist(p)

# Figure.text (aka. plt.figtext) behaves like Axes.text (aka. plt.text), with
# the sole exception that the coordinates are relative to the figure ((0, 0) is
# bottom left and (1, 1) is upper right).
fig.text(left, bottom, 'left top',
         horizontalalignment='left', verticalalignment='top')
fig.text(left, bottom, 'left bottom',
         horizontalalignment='left', verticalalignment='bottom')
fig.text(right, top, 'right bottom',
         horizontalalignment='right', verticalalignment='bottom')
fig.text(right, top, 'right top',
         horizontalalignment='right', verticalalignment='top')
fig.text(right, bottom, 'center top',
         horizontalalignment='center', verticalalignment='top')
fig.text(left, 0.5*(bottom+top), 'right center',
         horizontalalignment='right', verticalalignment='center',
         rotation='vertical')
fig.text(left, 0.5*(bottom+top), 'left center',
         horizontalalignment='left', verticalalignment='center',
         rotation='vertical')
fig.text(0.5*(left+right), 0.5*(bottom+top), 'middle',
         horizontalalignment='center', verticalalignment='center',
         fontsize=20, color='red')
fig.text(right, 0.5*(bottom+top), 'centered',
         horizontalalignment='center', verticalalignment='center',
         rotation='vertical')
fig.text(left, top, 'rotated\nwith newlines',
         horizontalalignment='center', verticalalignment='center',
         rotation=45)

plt.show()

References
The use of the following functions, methods, classes and modules is shown in this example:
import matplotlib
matplotlib.figure.Figure.add_artist
matplotlib.figure.Figure.text
Out:
<function Figure.text at 0x7f73be890dc0>
Keywords: matplotlib code example, codex, python plot, pyplot Gallery generated by Sphinx-Gallery