Note
Click here to download the full example code
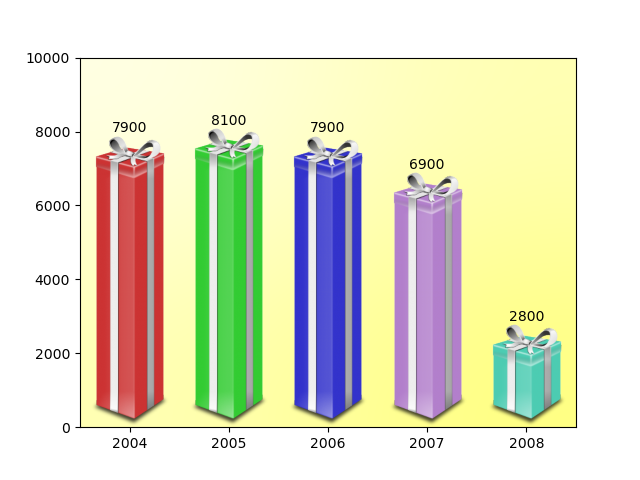
Ribbon Box

import numpy as np

from matplotlib import cbook, colors as mcolors
from matplotlib.image import AxesImage
import matplotlib.pyplot as plt
from matplotlib.transforms import Bbox, TransformedBbox, BboxTransformTo


class RibbonBox:

    original_image = plt.imread(
        cbook.get_sample_data("Minduka_Present_Blue_Pack.png"))
    cut_location = 70
    b_and_h = original_image[:, :, 2:3]
    color = original_image[:, :, 2:3] - original_image[:, :, 0:1]
    alpha = original_image[:, :, 3:4]
    nx = original_image.shape[1]

    def __init__(self, color):
        rgb = mcolors.to_rgba(color)[:3]
        self.im = np.dstack(
            [self.b_and_h - self.color * (1 - np.array(rgb)), self.alpha])

    def get_stretched_image(self, stretch_factor):
        stretch_factor = max(stretch_factor, 1)
        ny, nx, nch = self.im.shape
        ny2 = int(ny*stretch_factor)
        return np.vstack(
            [self.im[:self.cut_location],
             np.broadcast_to(
                 self.im[self.cut_location], (ny2 - ny, nx, nch)),
             self.im[self.cut_location:]])


class RibbonBoxImage(AxesImage):
    zorder = 1

    def __init__(self, ax, bbox, color, *, extent=(0, 1, 0, 1), **kwargs):
        super().__init__(ax, extent=extent, **kwargs)
        self._bbox = bbox
        self._ribbonbox = RibbonBox(color)
        self.set_transform(BboxTransformTo(bbox))

    def draw(self, renderer, *args, **kwargs):
        stretch_factor = self._bbox.height / self._bbox.width

        ny = int(stretch_factor*self._ribbonbox.nx)
        if self.get_array() is None or self.get_array().shape[0] != ny:
            arr = self._ribbonbox.get_stretched_image(stretch_factor)
            self.set_array(arr)

        super().draw(renderer, *args, **kwargs)


def main():
    fig, ax = plt.subplots()

    years = np.arange(2004, 2009)
    heights = [7900, 8100, 7900, 6900, 2800]
    box_colors = [
        (0.8, 0.2, 0.2),
        (0.2, 0.8, 0.2),
        (0.2, 0.2, 0.8),
        (0.7, 0.5, 0.8),
        (0.3, 0.8, 0.7),
    ]

    for year, h, bc in zip(years, heights, box_colors):
        bbox0 = Bbox.from_extents(year - 0.4, 0., year + 0.4, h)
        bbox = TransformedBbox(bbox0, ax.transData)
        ax.add_artist(RibbonBoxImage(ax, bbox, bc, interpolation="bicubic"))
        ax.annotate(str(h), (year, h), va="bottom", ha="center")

    ax.set_xlim(years[0] - 0.5, years[-1] + 0.5)
    ax.set_ylim(0, 10000)

    background_gradient = np.zeros((2, 2, 4))
    background_gradient[:, :, :3] = [1, 1, 0]
    background_gradient[:, :, 3] = [[0.1, 0.3], [0.3, 0.5]]  # alpha channel
    ax.imshow(background_gradient, interpolation="bicubic", zorder=0.1,
              extent=(0, 1, 0, 1), transform=ax.transAxes, aspect="auto")

    plt.show()


main()
Total running time of the script: ( 0 minutes 1.615 seconds)
Keywords: matplotlib code example, codex, python plot, pyplot Gallery generated by Sphinx-Gallery