matplotlib.gridspec.GridSpecBase
-
class
matplotlib.gridspec.GridSpecBase(nrows, ncols, height_ratios=None, width_ratios=None)[source]¶ Bases:
objectA base class of GridSpec that specifies the geometry of the grid that a subplot will be placed.
Parameters: - nrows, ncolsint
The number of rows and columns of the grid.
- width_ratiosarray-like of length ncols, optional
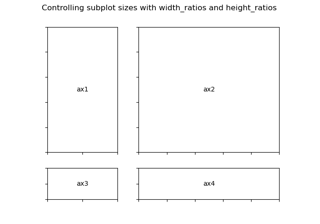
Defines the relative widths of the columns. Each column gets a relative width of
width_ratios[i] / sum(width_ratios). If not given, all columns will have the same width.- height_ratiosarray-like of length nrows, optional
Defines the relative heights of the rows. Each column gets a relative height of
height_ratios[i] / sum(height_ratios). If not given, all rows will have the same height.
-
__dict__= mappingproxy({'__module__': 'matplotlib.gridspec', '__doc__': '\n A base class of GridSpec that specifies the geometry of the grid\n that a subplot will be placed.\n ', '__init__': <function GridSpecBase.__init__>, '__repr__': <function GridSpecBase.__repr__>, 'nrows': <property object>, 'ncols': <property object>, 'get_geometry': <function GridSpecBase.get_geometry>, 'get_subplot_params': <function GridSpecBase.get_subplot_params>, 'new_subplotspec': <function GridSpecBase.new_subplotspec>, 'set_width_ratios': <function GridSpecBase.set_width_ratios>, 'get_width_ratios': <function GridSpecBase.get_width_ratios>, 'set_height_ratios': <function GridSpecBase.set_height_ratios>, 'get_height_ratios': <function GridSpecBase.get_height_ratios>, 'get_grid_positions': <function GridSpecBase.get_grid_positions>, '__getitem__': <function GridSpecBase.__getitem__>, 'subplots': <function GridSpecBase.subplots>, '__dict__': <attribute '__dict__' of 'GridSpecBase' objects>, '__weakref__': <attribute '__weakref__' of 'GridSpecBase' objects>, '__annotations__': {}})
-
__getitem__(key)[source]¶ Create and return a
SubplotSpecinstance.
-
__init__(nrows, ncols, height_ratios=None, width_ratios=None)[source]¶ Parameters: - nrows, ncolsint
The number of rows and columns of the grid.
- width_ratiosarray-like of length ncols, optional
Defines the relative widths of the columns. Each column gets a relative width of
width_ratios[i] / sum(width_ratios). If not given, all columns will have the same width.- height_ratiosarray-like of length nrows, optional
Defines the relative heights of the rows. Each column gets a relative height of
height_ratios[i] / sum(height_ratios). If not given, all rows will have the same height.
-
__module__= 'matplotlib.gridspec'
-
__weakref__¶ list of weak references to the object (if defined)
-
get_grid_positions(fig, raw=False)[source]¶ Return the positions of the grid cells in figure coordinates.
Parameters: - fig
Figure The figure the grid should be applied to. The subplot parameters (margins and spacing between subplots) are taken from fig.
- rawbool, default: False
If True, the subplot parameters of the figure are not taken into account. The grid spans the range [0, 1] in both directions without margins and there is no space between grid cells. This is used for constrained_layout.
Returns: - bottoms, tops, lefts, rightsarray
The bottom, top, left, right positions of the grid cells in figure coordinates.
- fig
-
get_height_ratios()[source]¶ Return the height ratios.
This is None if no height ratios have been set explicitly.
-
get_width_ratios()[source]¶ Return the width ratios.
This is None if no width ratios have been set explicitly.
-
property
ncols¶ The number of columns in the grid.
-
new_subplotspec(loc, rowspan=1, colspan=1)[source]¶ Create and return a
SubplotSpecinstance.Parameters: - loc(int, int)
The position of the subplot in the grid as
(row_index, column_index).- rowspan, colspanint, default: 1
The number of rows and columns the subplot should span in the grid.
-
property
nrows¶ The number of rows in the grid.
-
set_height_ratios(height_ratios)[source]¶ Set the relative heights of the rows.
height_ratios must be of length nrows. Each row gets a relative height of
height_ratios[i] / sum(height_ratios).
-
set_width_ratios(width_ratios)[source]¶ Set the relative widths of the columns.
width_ratios must be of length ncols. Each column gets a relative width of
width_ratios[i] / sum(width_ratios).
-
subplots(*, sharex=False, sharey=False, squeeze=True, subplot_kw=None)[source]¶ Add all subplots specified by this
GridSpecto its parent figure.This utility wrapper makes it convenient to create common layouts of subplots in a single call.
Parameters: - sharex, shareybool or {'none', 'all', 'row', 'col'}, default: False
Controls sharing of properties among x (sharex) or y (sharey) axes:
- True or 'all': x- or y-axis will be shared among all subplots.
- False or 'none': each subplot x- or y-axis will be independent.
- 'row': each subplot row will share an x- or y-axis.
- 'col': each subplot column will share an x- or y-axis.
When subplots have a shared x-axis along a column, only the x tick labels of the bottom subplot are created. Similarly, when subplots have a shared y-axis along a row, only the y tick labels of the first column subplot are created. To later turn other subplots' ticklabels on, use
tick_params.- squeezebool, optional, default: True
- If True, extra dimensions are squeezed out from the returned
array of Axes:
- if only one subplot is constructed (nrows=ncols=1), the resulting single Axes object is returned as a scalar.
- for Nx1 or 1xM subplots, the returned object is a 1D numpy object array of Axes objects.
- for NxM, subplots with N>1 and M>1 are returned as a 2D array.
- If False, no squeezing at all is done: the returned Axes object is always a 2D array containing Axes instances, even if it ends up being 1x1.
- If True, extra dimensions are squeezed out from the returned
array of Axes:
- subplot_kwdict, optional
Dict with keywords passed to the
add_subplotcall used to create each subplot.
Returns:
