matplotlib.colors.TwoSlopeNorm
-
class
matplotlib.colors.TwoSlopeNorm(vcenter, vmin=None, vmax=None)[source]¶ Bases:
matplotlib.colors.NormalizeNormalize data with a set center.
Useful when mapping data with an unequal rates of change around a conceptual center, e.g., data that range from -2 to 4, with 0 as the midpoint.
Parameters: - vcenterfloat
The data value that defines
0.5in the normalization.- vminfloat, optional
The data value that defines
0.0in the normalization. Defaults to the min value of the dataset.- vmaxfloat, optional
The data value that defines
1.0in the normalization. Defaults to the the max value of the dataset.
Examples
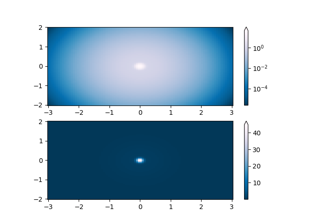
This maps data value -4000 to 0., 0 to 0.5, and +10000 to 1.0; data between is linearly interpolated:
-
__init__(vcenter, vmin=None, vmax=None)[source]¶ Normalize data with a set center.
Useful when mapping data with an unequal rates of change around a conceptual center, e.g., data that range from -2 to 4, with 0 as the midpoint.
Parameters: - vcenterfloat
The data value that defines
0.5in the normalization.- vminfloat, optional
The data value that defines
0.0in the normalization. Defaults to the min value of the dataset.- vmaxfloat, optional
The data value that defines
1.0in the normalization. Defaults to the the max value of the dataset.
Examples
This maps data value -4000 to 0., 0 to 0.5, and +10000 to 1.0; data between is linearly interpolated:
-
__module__= 'matplotlib.colors'
-
__slotnames__= []
