RunServerPlus
- synopsis
RunServerPlus-typical runserver with Werkzeug debugger baked in
Introduction
This item requires that you have the Werkzeug WSGI utilities installed. Included with Werkzeug is a kick ass debugger that renders nice debugging tracebacks and adds an AJAX based debugger (which allows code execution in the context of the traceback’s frames). Additionally it provides a nice access view to the source code.
Getting Started
To get started we just use the runserver_plus command instead of the normal runserver command:
$ python manage.py runserver_plus

* Running on http://127.0.0.1:8000/
* Restarting with reloader...

Validating models...
0 errors found

Django version X.Y.Z, using settings 'screencasts.settings'
Development server is running at http://127.0.0.1:8000/
Using the Werkzeug debugger (http://werkzeug.pocoo.org/)
Quit the server with CONTROL-C.
Note: all normal runserver options apply. In other words, if you need to change the port number or the host information, you can do so like you would normally.
Usage
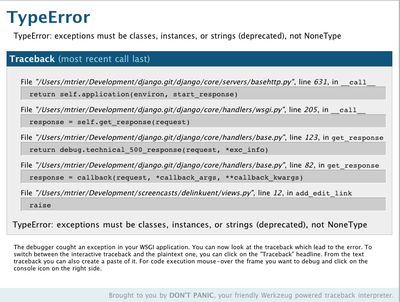
Instead of the default Django traceback page, the Werkzeug traceback page will be shown when an exception occurs.

Along with the typical traceback information we have a couple of options. These options appear when hovering over a particular traceback line. Notice that two buttons appear to the right:

The options are:
View Source
This displays the source underneath the traceback:

Being able to view the source file is handy because it provides more context information around the error. The actual traceback areas are highlighted so they are easy to spot.
One awkward aspect of the UI is that the page is not scrolled to the bottom. At first I thought nothing was happening because of this.
Interactive Debugging Console
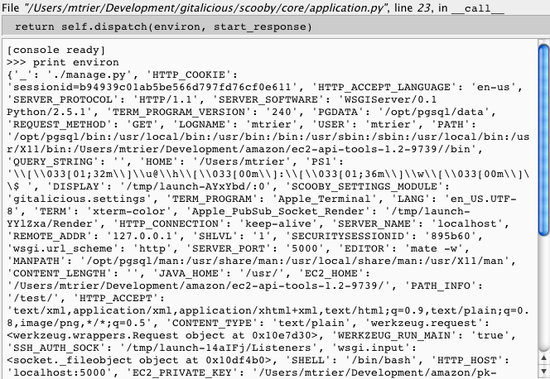
Clicking on this button opens up a new pane under the traceback line you’re on. This is the money shot:

An ajax based console appears in the pane and you can start debugging. Notice in the screenshot above I did a print environ to see what was in the environment parameter coming into the function.
WARNING: This should never be used in any kind of production environment. Not even for a quick problem check. I cannot emphasize this enough. The interactive debugger allows you to evaluate python code right against the server. You’ve been warned.
SSL
runserver_plus also supports SSL, so that you can easily debug bugs that pop up when https is used. To use SSL simply provide a file name for certificates; a key and certificate file will be automatically generated:
$ python manage.py runserver_plus --cert-file cert.crt
Validating models...
0 errors found

Django version X.Y.Z, using settings 'mysite.settings'
Development server is running at http://127.0.0.1:8000/
Using the Werkzeug debugger (http://werkzeug.pocoo.org/)
Quit the server with CONTROL-C.
 * Running on https://127.0.0.1:8000/
 * Restarting with reloader
Validating models...
0 errors found

Django version X.Y.Z, using settings 'mysite.settings'
Development server is running at http://127.0.0.1:8000/
Using the Werkzeug debugger (http://werkzeug.pocoo.org/)
Quit the server with CONTROL-C.
After running this command, your web application can be accessed through https://127.0.0.1:8000.
You will also find that two files are created in the current working directory: a key file and a certificate file. If you run the above command again, these certificate files will be reused so that you do not have to keep accepting the self-generated certificates from your browser every time. You can also provide a specific file for the certificate to be used if you already have one:
$ python manage.py runserver_plus --cert-file /tmp/cert.crt
Note that you need the OpenSSL library to use SSL, and Werkzeug 0.9 or later if you want to reuse existing certificates.
To install OpenSSL:
$ pip install pyOpenSSL
Certificates paths
You can configure different paths to .crt and .key files.
At least one of --cert-file or --key-file must be defined to use SSL.
You can set path to .crt file using --cert-file option or deprecated --cert option
which is currently an alias for --cert-file.
If this option is not set than runserver_plus assumes that,
this file is in the same directory as file from --key-file option.
You can set path to .key file using --key-file option.
If this option is not set than runserver_plus assumes that,
this file is in the same directory as file from --cert-file option.
If you want to create new files, than you can pass file name without extension. Proper files with this name and .crt and .key extensions will be created.
Configuration
The RUNSERVERPLUS_SERVER_ADDRESS_PORT setting can be configured to specify which address and port the development server should bind to.
If you find yourself frequently starting the server with:
$ python manage.py runserver_plus 0.0.0.0:8000
You can use settings to automatically default your development to an address/port:
RUNSERVERPLUS_SERVER_ADDRESS_PORT = '0.0.0.0:8000'
To ensure Werkzeug can log to the console, you may need to add the following to your settings:
LOGGING = {
    ...
    'handlers': {
        ...
        'console': {
            'level': 'DEBUG',
            'class': 'logging.StreamHandler',
        },
    },
    'loggers': {
        ...
        'werkzeug': {
            'handlers': ['console'],
            'level': 'DEBUG',
            'propagate': True,
        },
    },
}
Other configuration options and their defaults include:
# Truncate SQL queries to this many characters (None means no truncation)
RUNSERVER_PLUS_PRINT_SQL_TRUNCATE = 1000

# After how many seconds auto-reload should scan for updates in poller-mode
RUNSERVERPLUS_POLLER_RELOADER_INTERVAL = 1

# Werkzeug reloader type [auto, watchdog, or stat]
RUNSERVERPLUS_POLLER_RELOADER_TYPE = 'auto'

# Add extra files to watch
RUNSERVER_PLUS_EXTRA_FILES = []

# Do not watch files matching any of these patterns
RUNSERVER_PLUS_EXCLUDE_PATTERNS = []
IO Calls and CPU Usage
As noted in gh625 runserver_plus can be seen to use a lot of CPU and generate many I/O when idle.
This is due to the way Werkzeug has implemented the auto reload capability. It supports two ways of doing auto reloading either via stat polling or file system events.
The stat polling approach is pretty brute force and continously issues stat system calls which causes the CPU and IO load.
If possible try to install the Watchdog package, this should automatically cause Werkzeug to use file system events whenever possible.
You can read more about this in Werkzeug documentation
You can also increase the poll interval when using stat polling from the default of 1 second. This will decrease the CPU load at the expense of file edits taking longer to pick up.
This can be set two ways, in the django settings file:
RUNSERVERPLUS_POLLER_RELOADER_INTERVAL = 5
or as a commad line argument:
$ python manage.py runserver_plus --reloader-interval 5
Debugger PIN
The following text about the debugger PIN is taken verbatim from the Werkzeug documentation about its debugger PIN.
Starting with Werkzeug 0.11 the debugger is additionally protected by a PIN. This is a security helper to make it less likely for the debugger to be exploited in production as it has happened to people to keep the debugger active. The PIN based authentication is enabled by default.
When the debugger comes up, on first usage it will prompt for a PIN that is printed to the command line. The PIN is generated in a stable way that is specific to the project. In some situations it might be not possible to generate a stable PIN between restarts in which case an explicit PIN can be provided through the environment variable WERKZEUG_DEBUG_PIN. This can be set to a number and will become the PIN. This variable can also be set to the value off to disable the PIN check entirely.
The PIN can also be disabled by passing the argument --nopin when calling the runserver_plus command.
If the PIN is entered too many times incorrectly the server needs to be restarted.
This feature is not supposed to entirely secure the debugger. It’s intended to make it harder for an attacker to exploit the debugger. Never enable the debugger in production.