SVO Filter Profile Service Queries (astroquery.svo_fps)
Getting started
This is a python interface for querying the Spanish Virtual Observatory’s Filter Profile Service (SVO FPS). It allows retrieval of filter data (index, transmission data, filter list, etc.) from the service as astropy tables.
Get index list of all Filters
The filter index (all available filters with their properties) can be listed
with get_filter_index:
>>> from astroquery.svo_fps import SvoFps
>>> index = SvoFps.get_filter_index()
>>> index.info
<Table masked=True length=5139>
        name          dtype  unit
-------------------- ------- ----
FilterProfileService  object
            filterID  object
      WavelengthUnit  object
       WavelengthUCD  object
          PhotSystem  object
        DetectorType  object
                Band  object
          Instrument  object
            Facility  object
    ProfileReference  object
CalibrationReference  object
         Description  object
            Comments  object
      WavelengthMean float32   AA
       WavelengthEff float32   AA
       WavelengthMin float32   AA
       WavelengthMax float32   AA
            WidthEff float32   AA
       WavelengthCen float32   AA
     WavelengthPivot float32   AA
      WavelengthPeak float32   AA
      WavelengthPhot float32   AA
                FWHM float32   AA
           PhotCalID  object
              MagSys  object
           ZeroPoint float32   Jy
       ZeroPointUnit  object
                Mag0 float32
       ZeroPointType  object
           AsinhSoft float32
    TrasmissionCurve  object
There are options to downselect based on the minimum
and maximum effective wavelength (wavelength_eff_min
and wavelength_eff_max, respectively).
Get list of Filters under a specified Facilty and Instrument
Similarly, get_filter_list retrieves a list of all
Filters for an arbitrary combination of Facility & Instrument (the Facility
must be specified, but the Instrument is optional). The data table returned
is of the same form as that from get_filter_index:
>>> filter_list = SvoFps.get_filter_list(facility='Keck', instrument='NIRC2')
>>> filter_list.info

<Table masked=True length=11>
        name          dtype  unit
-------------------- ------- ----
FilterProfileService  object
            filterID  object
      WavelengthUnit  object
       WavelengthUCD  object
          PhotSystem  object
        DetectorType  object
                Band  object
          Instrument  object
            Facility  object
    ProfileReference  object
CalibrationReference  object
         Description  object
            Comments  object
      WavelengthMean float32   AA
       WavelengthEff float32   AA
       WavelengthMin float32   AA
       WavelengthMax float32   AA
            WidthEff float32   AA
       WavelengthCen float32   AA
     WavelengthPivot float32   AA
      WavelengthPeak float32   AA
      WavelengthPhot float32   AA
                FWHM float32   AA
           PhotCalID  object
              MagSys  object
           ZeroPoint float32   Jy
       ZeroPointUnit  object
                Mag0 float32
       ZeroPointType  object
           AsinhSoft float32
    TrasmissionCurve  object
Get transmission data for a specific Filter
If you know the filterID of the filter (which you can determine with
get_filter_list or
get_filter_index), you can retrieve the
transmission curve data using
get_transmission_data:
>>> data = SvoFps.get_transmission_data('2MASS/2MASS.H')
>>> print(data)
Wavelength Transmission
    AA
---------- ------------
12890.0          0.0
13150.0          0.0
13410.0          0.0
13680.0          0.0
13970.0          0.0
14180.0          0.0
14400.0       0.0005
14620.0       0.0028
14780.0       0.0081
14860.0       0.0287
    ...          ...
18030.0       0.1077
18100.0       0.0707
18130.0       0.0051
18180.0         0.02
18280.0       0.0004
18350.0          0.0
18500.0        1e-04
18710.0          0.0
18930.0          0.0
19140.0          0.0
Length = 58 rows
These are the data needed to plot the transmission curve for filter:
>>> import matplotlib.pyplot as plt
>>> plt.plot(data['Wavelength'], data['Transmission'])
>>> plt.xlabel('Wavelength (Angstroms)')
>>> plt.ylabel('Transmission Fraction')
>>> plt.title('Filter Curve for 2MASS/2MASS.H')
>>> plt.show()
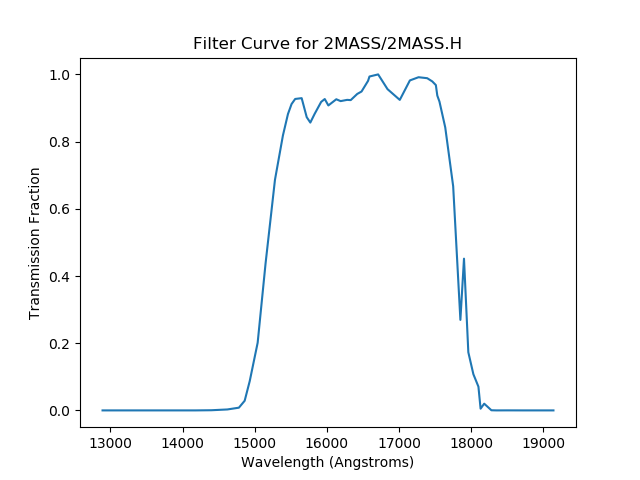
The 2MASS H-band transmission curve
Reference/API
astroquery.svo_fps Package
SVO FPS query tool
Access to the Spanish Virtual Observatory (SVO) Filter Profile Service (FPS).
Classes
Class for querying the Spanish Virtual Observatory filter profile service |
|
|
Configuration parameters for |