Note
Click here to download the full example code
Convert a 3-color image (JPG) to separate FITS images
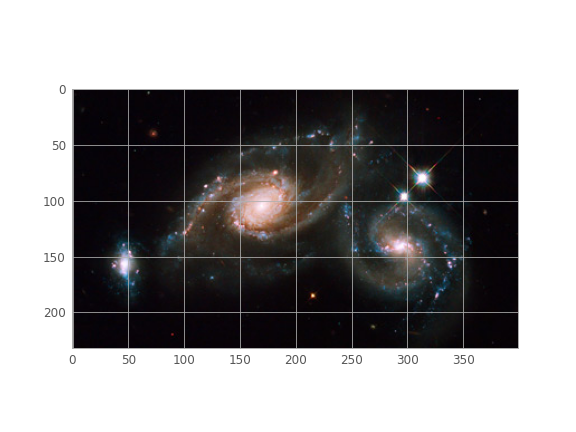
This example opens an RGB JPEG image and writes out each channel as a separate FITS (image) file.
This example uses pillow to read the image,
matplotlib.pyplot to display the image, and astropy.io.fits to save FITS files.
By: Erik Bray, Adrian Price-Whelan
License: BSD
import matplotlib.pyplot as plt
import numpy as np
from PIL import Image

from astropy.io import fits
from astropy.visualization import astropy_mpl_style
Set up matplotlib and use a nicer set of plot parameters
plt.style.use(astropy_mpl_style)
Load and display the original 3-color jpeg image:
image = Image.open('Hs-2009-14-a-web.jpg')
xsize, ysize = image.size
print(f"Image size: {ysize} x {xsize}")
print(f"Image bands: {image.getbands()}")
ax = plt.imshow(image)

Out:
Image size: 232 x 400
Image bands: ('R', 'G', 'B')
Split the three channels (RGB) and get the data as Numpy arrays. The arrays are flattened, so they are 1-dimensional:
Out:
(92800,)
Reshape the image arrays to be 2-dimensional:
Out:
(232, 400)
Write out the channels as separate FITS images. Add and visualize header info
red = fits.PrimaryHDU(data=r_data)
red.header['LATOBS'] = "32:11:56" # add spurious header info
red.header['LONGOBS'] = "110:56"
red.writeto('red.fits')

green = fits.PrimaryHDU(data=g_data)
green.header['LATOBS'] = "32:11:56"
green.header['LONGOBS'] = "110:56"
green.writeto('green.fits')

blue = fits.PrimaryHDU(data=b_data)
blue.header['LATOBS'] = "32:11:56"
blue.header['LONGOBS'] = "110:56"
blue.writeto('blue.fits')

from pprint import pprint

pprint(red.header)
Out:
SIMPLE  =                    T / conforms to FITS standard
BITPIX  =                   64 / array data type
NAXIS   =                    2 / number of array dimensions
NAXIS1  =                  400
NAXIS2  =                  232
EXTEND  =                    T
LATOBS  = '32:11:56'
LONGOBS = '110:56  '
Delete the files created
import os

os.remove('red.fits')
os.remove('green.fits')
os.remove('blue.fits')
Total running time of the script: ( 0 minutes 0.156 seconds)