ArcCosine1D
- class astropy.modeling.functional_models.ArcCosine1D(*args, meta=None, name=None, **kwargs)[source]
Bases:
_InverseTrigonometric1DOne dimensional ArcCosine returning values between 0 and pi only.
- Parameters:
- amplitude
python:float Oscillation amplitude for corresponding Cosine
- frequency
python:float Oscillation frequency for corresponding Cosine
- phase
python:float Oscillation phase for corresponding Cosine
- amplitude
- Other Parameters:
- fixed
apython:dict, optional A dictionary
{parameter_name: boolean}of parameters to not be varied during fitting. True means the parameter is held fixed. Alternatively thefixedproperty of a parameter may be used.- tied
python:dict, optional A dictionary
{parameter_name: callable}of parameters which are linked to some other parameter. The dictionary values are callables providing the linking relationship. Alternatively thetiedproperty of a parameter may be used.- bounds
python:dict, optional A dictionary
{parameter_name: value}of lower and upper bounds of parameters. Keys are parameter names. Values are a list or a tuple of length 2 giving the desired range for the parameter. Alternatively, theminandmaxproperties of a parameter may be used.- eqcons
python:list, optional A list of functions of length
nsuch thateqcons[j](x0,*args) == 0.0in a successfully optimized problem.- ineqcons
python:list, optional A list of functions of length
nsuch thatieqcons[j](x0,*args) >= 0.0is a successfully optimized problem.
- fixed
See also
Notes
Model formula:
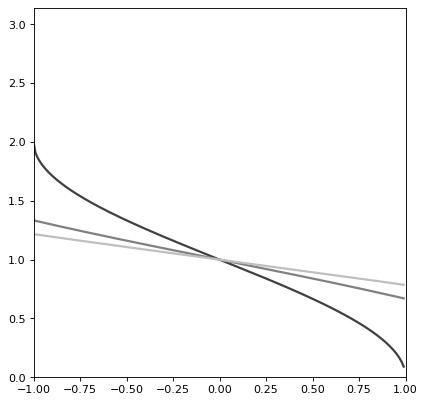
\[f(x) = ((arccos(x / A) / 2pi) - p) / f\]The arccos function being used for this model will only accept inputs in [-A, A]; otherwise, a runtime warning will be thrown and the result will be NaN. To avoid this, the bounding_box has been properly set to accommodate this; therefore, it is recommended that this model always be evaluated with the
with_bounding_box=Trueoption.Examples
import numpy as np
import matplotlib.pyplot as plt

from astropy.modeling.models import ArcCosine1D

plt.figure()
s1 = ArcCosine1D(amplitude=1, frequency=.25)
r=np.arange(-1, 1, .01)

for amplitude in range(1,4):
     s1.amplitude = amplitude
     plt.plot(r, s1(r), color=str(0.25 * amplitude), lw=2)

plt.axis([-1, 1, 0, np.pi])
plt.show()

Methods Summary
evaluate(x, amplitude, frequency, phase)One dimensional ArcCosine model function
fit_deriv(x, amplitude, frequency, phase)One dimensional ArcCosine model derivative
Methods Documentation