Profiling
Memory profiling is essential to identify issues that may cause memory corruption, which may lead to all sorts of side-effects, such as crashing after many hours of simulation and producing wrong results that invalidate the entire simulation.
It also can help tracking sources of excessive memory allocations, the size of these allocations and memory usage during simulation. These can affect simulation performance, or limit the complexity and the number of concurrent simulations.
Performance profiling on the other hand is essential for high-performance applications, as it allows for the identification of bottlenecks and their mitigation.
Another type of profiling is related to system calls. They can be used to debug issues and identify hotspots that may cause performance issues in specific conditions. Excessive calls results in more context switches, which interrupt the simulations, ultimately slowing them down.
Other than profiling the simulations, which can highlight bottlenecks in the simulator, we can also profile the compilation process. This allows us to identify and fix bottlenecks, which speed up build times.
Memory Profilers
Memory profilers are tools that help identifying memory related issues.
There are two well known tools for finding bugs such as uninitialized memory usage, out-of-bound accesses, dereferencing null pointers and other memory-related bugs:
-
Pros: very rich tooling, no need to recompile programs to profile the program.
Cons: very slow and limited to Linux and MacOS.
-
Pros: sanitizers are distributed along with compilers, such as GCC, Clang and MSVC. They are widely available, cross platform and faster than Valgrind.
Cons: false positives, high memory usage, memory sanitizer is incompatible with other sanitizers (e.g. address sanitizer), requiring two instrumented compilations and two test runs. The memory sanitizer requires Clang.
There are also tools to count memory allocations, track memory usage and memory leaks, such as: Heaptrack, MacOS’s leaks, Bytehound and gperftools.
An overview on how to use Valgrind, Sanitizers and Heaptrack is provided in the following sections.
Valgrind
Valgrind is suite of profiling tools, being the main tool called Memcheck. To check for memory errors including leaks, one can call valgrind directly:
valgrind --leak-check=yes ./relative/path/to/program argument1 argument2
Or can use the ns3 script:
./ns3 run "program argument1 argument2" --valgrind
Additional Valgrind options are listed on its manual.
Sanitizers
Sanitizers are a suite of libraries made by Google and part of the LLVM project, used to profile programs at runtime and find issues related to undefined behavior, memory corruption (out-of-bound access, uninitialized memory use), leaks, race conditions and others.
Sanitizers are shipped with most modern compilers and can be used by instructing the compiler to link the required libraries and instrument the code.
To build ns-3 with sanitizers, enable the NS3_SANITIZE option. This can be done
directly via CMake:
~/ns-3-dev/cmake_cache/$ cmake -DNS3_SANITIZE=ON ..
Or via the ns3 wrapper:
~/ns-3-dev$ ./ns3 configure --enable-sanitizers
The memory sanitizer can be enabled with NS3_SANITIZE_MEMORY, but it is not
compatible with NS3_SANITIZE and only works with the Clang compiler.
Sanitizers were used to find issues in multiple occasions:
A global buffer overflow in the LTE module
When the wrong index (-1) was used to access a
int [][]variable, a different variable that is stored closely in memory was accessed.In the best case scenario, this results in reading an incorrect value that causes the program to fail
In the worst case scenario, this value is overwritten corrupting the program memory
The likely scenario: wrong value is read and the program continued running, potentially producing incorrect results
~/ns-3-dev/src/lte/model/lte-amc.cc:303:43: runtime error: index -1 out of bounds for type 'int [110][27]'
=================================================================
==51636==ERROR: AddressSanitizer: global-buffer-overflow on address 0x7fe78cc2dbbc at pc 0x7fe78ba65e65 bp 0x7ffde70b25c0 sp 0x7ffde70b25b0
READ of size 4 at 0x7fe78cc2dbbc thread T0
    #0 0x7fe78ba65e64 in ns3::LteAmc::GetDlTbSizeFromMcs(int, int) ~/ns-3-dev/src/lte/model/lte-amc.cc:303
    #1 0x7fe78c538aba in ns3::TdTbfqFfMacScheduler::DoSchedDlTriggerReq(ns3::FfMacSchedSapProvider::SchedDlTriggerReqParameters const&) ~/ns-3-dev/src/lte/model/tdtbfq-ff-mac-scheduler.cc:1160
    #2 0x7fe78c564736 in ns3::MemberSchedSapProvider<ns3::TdTbfqFfMacScheduler>::SchedDlTriggerReq(ns3::FfMacSchedSapProvider::SchedDlTriggerReqParameters const&) ~/ns-3-dev/build/include/ns3/ff-mac-sched-sap.h:409
    #3 0x7fe78c215596 in ns3::LteEnbMac::DoSubframeIndication(unsigned int, unsigned int) ~/ns-3-dev/src/lte/model/lte-enb-mac.cc:588
    #4 0x7fe78c20921d in ns3::EnbMacMemberLteEnbPhySapUser::SubframeIndication(unsigned int, unsigned int) ~/ns-3-dev/src/lte/model/lte-enb-mac.cc:297
    #5 0x7fe78b924105 in ns3::LteEnbPhy::StartSubFrame() ~/ns-3-dev/src/lte/model/lte-enb-phy.cc:764
    #6 0x7fe78b949d54 in ns3::MakeEvent<void (ns3::LteEnbPhy::*)(), ns3::LteEnbPhy*>(void (ns3::LteEnbPhy::*)(), ns3::LteEnbPhy*)::EventMemberImpl0::Notify() (~/ns-3-dev/build/lib/libns3-dev-lte-deb.so+0x3a9cd54)
    #7 0x7fe795252022 in ns3::EventImpl::Invoke() ~/ns-3-dev/src/core/model/event-impl.cc:51
    #8 0x7fe795260de2 in ns3::DefaultSimulatorImpl::ProcessOneEvent() ~/ns-3-dev/src/core/model/default-simulator-impl.cc:151
    #9 0x7fe795262dbd in ns3::DefaultSimulatorImpl::Run() ~/ns-3-dev/src/core/model/default-simulator-impl.cc:204
    #10 0x7fe79525436f in ns3::Simulator::Run() ~/ns-3-dev/src/core/model/simulator.cc:176
    #11 0x7fe7b0f77ee2 in LteDistributedFfrAreaTestCase::DoRun() ~/ns-3-dev/src/lte/test/lte-test-frequency-reuse.cc:1777
    #12 0x7fe7952d125a in ns3::TestCase::Run(ns3::TestRunnerImpl*) ~/ns-3-dev/src/core/model/test.cc:363
    #13 0x7fe7952d0f4d in ns3::TestCase::Run(ns3::TestRunnerImpl*) ~/ns-3-dev/src/core/model/test.cc:357
    #14 0x7fe7952e39c0 in ns3::TestRunnerImpl::Run(int, char**) ~/ns-3-dev/src/core/model/test.cc:1094
    #15 0x7fe7952e427e in ns3::TestRunner::Run(int, char**) ~/ns-3-dev/src/core/model/test.cc:1118
    #16 0x564a13d67c9c in main ~/ns-3-dev/utils/test-runner.cc:23
    #17 0x7fe793cde0b2 in __libc_start_main (/lib/x86_64-linux-gnu/libc.so.6+0x270b2)
    #18 0x564a13d67bbd in _start (~/ns-3-dev/build/utils/test-runner+0xae0bbd)
0x7fe78cc2dbbc is located 40 bytes to the right of global variable 'McsToItbsUl' defined in '~/ns-3-dev/src/lte/model/lte-amc.cc:105:18' (0x7fe78cc2db20) of size 116
0x7fe78cc2dbbc is located 4 bytes to the left of global variable 'TransportBlockSizeTable' defined in '~/ns-3-dev/src/lte/model/lte-amc.cc:118:18' (0x7fe78cc2dbc0) of size 11880
SUMMARY: AddressSanitizer: global-buffer-overflow ~/ns-3-dev/src/lte/model/lte-amc.cc:303 in ns3::LteAmc::GetDlTbSizeFromMcs(int, int)
Shadow bytes around the buggy address:
  0x0ffd7197db50: 00 00 00 00 00 00 00 00 00 00 00 00 00 00 04 f9
  0x0ffd7197db60: f9 f9 f9 f9 00 00 00 00 00 00 00 00 00 00 00 00
=>0x0ffd7197db70: 00 00 04 f9 f9 f9 f9[f9]00 00 00 00 00 00 00 00
Shadow byte legend (one shadow byte represents 8 application bytes):
  Addressable:           00
  Partially addressable: 01 02 03 04 05 06 07
  Global redzone:        f9
==51636==ABORTING
The output above shows the type of error (
global-buffer-overflow), the stack-trace of where the bug happened (LteAmc::GetDlTbSizeFromMcs), affected variables (McsToItbsUlandTransportBlockSizeTable), and a shadow bytes map, showing the wrong access between square brackets.The the global redzone (f9) shadow bytes are empty memory allocated between global variables (00s and 04s), which are left there to be corrupted by the bugged program. Any eventual corruption is then traced back to the source, without affecting the program execution.
The adopted solution in merge request MR703 was to fix one of the schedulers that could produce the index value of -1, and updating the asserts to catch the illegal index value.
A wrong downcast in the Wimax module:
The pointer was casted incorrectly to U16TlvValue instead of U8TvlValue, which could have different sizes in memory leading to the program reading the wrong memory address. Reading the wrong memory address can result in unexpected or invalid values being read, which could change the program flow and corrupt memory, producing wrong simulation results or crashing the program.
~/ns-3-dev/src/wimax/model/service-flow.cc:159:86: runtime error: downcast of address 0x6020000148b0 which does not point to an object of type 'U16TlvValue'
0x6020000148b0: note: object is of type 'ns3::U8TlvValue'
48 00 00 36  c8 09 02 62 5c 7f 00 00  00 be be be be be be be  03 00 00 00 00 00 00 04  10 00 00 00
              ^~~~~~~~~~~~~~~~~~~~~~~
              vptr for 'ns3::U8TlvValue'
~/ns-3-dev/src/wimax/model/service-flow.cc:159:99: runtime error: member call on address 0x6020000148b0 which does not point to an object of type 'U16TlvValue'
0x6020000148b0: note: object is of type 'ns3::U8TlvValue'
48 00 00 36  c8 09 02 62 5c 7f 00 00  00 be be be be be be be  03 00 00 00 00 00 00 04  10 00 00 00
              ^~~~~~~~~~~~~~~~~~~~~~~
              vptr for 'ns3::U8TlvValue'
~/ns-3-dev/src/wimax/model/wimax-tlv.cc:589:10: runtime error: member access within address 0x6020000148b0 which does not point to an object of type 'U16TlvValue'
0x6020000148b0: note: object is of type 'ns3::U8TlvValue'
48 00 00 36  c8 09 02 62 5c 7f 00 00  00 be be be be be be be  03 00 00 00 00 00 00 04  10 00 00 00
              ^~~~~~~~~~~~~~~~~~~~~~~
              vptr for 'ns3::U8TlvValue'
The bug was fixed with the correct cast in merge request MR704.
Heaptrack
Heaptrack is an utility made by KDE to trace memory allocations along with stack traces, allowing developers to identify code responsible for possible memory leaks and unnecessary allocations.
For the examples below we used the default configuration of ns-3,
with the output going to the build directory. The actual executable
for the wifi-he-network example is ./build/examples/wireless/ns3-dev-wifi-he-network, which is what is
executed by ./ns3 run wifi-he-network.
To collect information of a program (in this case the wifi-he-network
example), run:
~ns-3-dev/$ heaptrack ./build/examples/wireless/ns3-dev-wifi-he-network --simulationTime=0.3 --frequency=5 --useRts=1 --minExpectedThroughput=6 --maxExpectedThroughput=745
If you prefer to use the ns3 wrapper, try:
~ns-3-dev/$ ./ns3 run "wifi-he-network --simulationTime=0.3 --frequency=5 --useRts=1 --minExpectedThroughput=6 --maxExpectedThroughput=745" --heaptrack --no-build
In both cases, heaptrack will print to the terminal the output file:
~ns-3-dev/$ ./ns3 run "wifi-he-network --simulationTime=0.3 --frequency=5 --useRts=1 --minExpectedThroughput=6 --maxExpectedThroughput=745" --heaptrack --no-build
heaptrack output will be written to "~ns-3-dev/heaptrack.ns3-dev-wifi-he-network.210305.zst"
starting application, this might take some time...
MCS value               Channel width           GI                      Throughput
0                       20 MHz                  3200 ns                 5.91733 Mbit/s
0                       20 MHz                  1600 ns                 5.91733 Mbit/s
...
11                      160 MHz                 1600 ns                 479.061 Mbit/s
11                      160 MHz                 800 ns                  524.459 Mbit/s
heaptrack stats:
        allocations:            149185947
        leaked allocations:     10467
        temporary allocations:  21145932
Heaptrack finished! Now run the following to investigate the data:

    heaptrack --analyze "~/ns-3-dev/heaptrack.ns3-dev-wifi-he-network.210305.zst"
The output above shows a summary of the stats collected: ~149 million allocations, ~21 million temporary allocations and ~10 thousand possible leaked allocations.
If heaptrack-gui is installed, running heaptrack will launch it. If it is not installed,
the command line interface will be used.
~/ns-3-dev$ heaptrack --analyze "~/ns-3-dev/heaptrack.ns3-dev-wifi-he-network.210305.zst"
reading file "~/ns-3-dev/heaptrack.ns3-dev-wifi-he-network.210305.zst" - please wait, this might take some time...
Debuggee command was: ~/ns-3-dev/build/examples/wireless/ns3-dev-wifi-he-network --simulationTime=0.3 --frequency=5 --useRts=1 --minExpectedThroughput=6 --maxExpectedThroughput=745
finished reading file, now analyzing data:

MOST CALLS TO ALLOCATION FUNCTIONS
23447502 calls to allocation functions with 1.12MB peak consumption from
ns3::Packet::Copy() const
in ~/ns-3-dev/build/lib/libns3-dev-network.so
4320000 calls with 0B peak consumption from:
    ns3::UdpSocketImpl::DoSendTo(ns3::Ptr<>, ns3::Ipv4Address, unsigned short, unsigned char)
    in ~/ns-3-dev/build/lib/libns3-dev-internet.so
    ns3::UdpSocketImpl::DoSend(ns3::Ptr<>)
    in ~/ns-3-dev/build/lib/libns3-dev-internet.so
    ns3::UdpSocketImpl::Send(ns3::Ptr<>, unsigned int)
    in ~/ns-3-dev/build/lib/libns3-dev-internet.so
    ns3::Socket::Send(ns3::Ptr<>)
    in ~/ns-3-dev/build/lib/libns3-dev-network.so
    ns3::UdpClient::Send()
    in ~/ns-3-dev/build/lib/libns3-dev-applications.so
    ns3::DefaultSimulatorImpl::ProcessOneEvent()
    in ~/ns-3-dev/build/lib/libns3-dev-core.so
    ns3::DefaultSimulatorImpl::Run()
    in ~/ns-3-dev/build/lib/libns3-dev-core.so
    main
    in ~/ns-3-dev/build/examples/wireless/ns3-dev-wifi-he-network

...

MOST TEMPORARY ALLOCATIONS
6182320 temporary allocations of 6182701 allocations in total (99.99%) from
ns3::QueueDisc::DropBeforeEnqueue(ns3::Ptr<>, char const*)
in ~/ns-3-dev/build/lib/libns3-dev-traffic-control.so
1545580 temporary allocations of 1545580 allocations in total (100.00%) from:
    std::_Function_handler<>::_M_invoke(std::_Any_data const&, ns3::Ptr<>&&, char const*&&)
    in ~/ns-3-dev/build/lib/libns3-dev-traffic-control.so
    std::function<>::operator()(ns3::Ptr<>, char const*) const
    in ~/ns-3-dev/build/lib/libns3-dev-traffic-control.so
    ns3::MemPtrCallbackImpl<>::operator()(ns3::Ptr<>, char const*)
    in ~/ns-3-dev/build/lib/libns3-dev-traffic-control.so
    ns3::TracedCallback<>::operator()(ns3::Ptr<>, char const*) const
    in ~/ns-3-dev/build/lib/libns3-dev-traffic-control.so
    ns3::QueueDisc::DropBeforeEnqueue(ns3::Ptr<>, char const*)
    in ~/ns-3-dev/build/lib/libns3-dev-traffic-control.so
    ns3::CoDelQueueDisc::DoEnqueue(ns3::Ptr<>)
    in ~/ns-3-dev/build/lib/libns3-dev-traffic-control.so
    ns3::QueueDisc::Enqueue(ns3::Ptr<>)
    in ~/ns-3-dev/build/lib/libns3-dev-traffic-control.so
    ns3::FqCoDelQueueDisc::DoEnqueue(ns3::Ptr<>)
    in ~/ns-3-dev/build/lib/libns3-dev-traffic-control.so
    ns3::QueueDisc::Enqueue(ns3::Ptr<>)
    in ~/ns-3-dev/build/lib/libns3-dev-traffic-control.so
    ns3::TrafficControlLayer::Send(ns3::Ptr<>, ns3::Ptr<>)
    in ~/ns-3-dev/build/lib/libns3-dev-traffic-control.so
    ns3::Ipv4Interface::Send(ns3::Ptr<>, ns3::Ipv4Header const&, ns3::Ipv4Address)
    in ~/ns-3-dev/build/lib/libns3-dev-internet.so
    ns3::Ipv4L3Protocol::SendRealOut(ns3::Ptr<>, ns3::Ptr<>, ns3::Ipv4Header const&)
    in ~/ns-3-dev/build/lib/libns3-dev-internet.so
    ns3::Ipv4L3Protocol::Send(ns3::Ptr<>, ns3::Ipv4Address, ns3::Ipv4Address, unsigned char, ns3::Ptr<>)
    in ~/ns-3-dev/build/lib/libns3-dev-internet.so
    ns3::UdpL4Protocol::Send(ns3::Ptr<>, ns3::Ipv4Address, ns3::Ipv4Address, unsigned short, unsigned short, ns3::Ptr<>)
    in ~/ns-3-dev/build/lib/libns3-dev-internet.so
    ns3::UdpSocketImpl::DoSendTo(ns3::Ptr<>, ns3::Ipv4Address, unsigned short, unsigned char)
    in ~/ns-3-dev/build/lib/libns3-dev-internet.so
    ns3::UdpSocketImpl::DoSend(ns3::Ptr<>)
    in ~/ns-3-dev/build/lib/libns3-dev-internet.so
    ns3::UdpSocketImpl::Send(ns3::Ptr<>, unsigned int)
    in ~/ns-3-dev/build/lib/libns3-dev-internet.so
    ns3::Socket::Send(ns3::Ptr<>)
    in ~/ns-3-dev/build/lib/libns3-dev-network.so
    ns3::UdpClient::Send()
    in ~/ns-3-dev/build/lib/libns3-dev-applications.so
    ns3::DefaultSimulatorImpl::ProcessOneEvent()
    in ~/ns-3-dev/build/lib/libns3-dev-core.so
    ns3::DefaultSimulatorImpl::Run()
    in ~/ns-3-dev/build/lib/libns3-dev-core.so
    main
    in ~/ns-3-dev/build/examples/wireless/ns3-dev-wifi-he-network

...

total runtime: 156.30s.
calls to allocation functions: 149185947 (954466/s)
temporary memory allocations: 21757614 (139201/s)
peak heap memory consumption: 4.87MB
peak RSS (including heaptrack overhead): 42.02MB
total memory leaked: 895.45KB
The terminal output above lists the most frequently called functions that allocated memory.
Here is a short description of what each line of the last block of the output means:
Allocation functions are all functions that allocated memory, either explicitly via C-style
mallocand C++new, or implicitly via RAII and automatic conversions.Temporary memory allocations are allocations that are followed by the deallocation without modifying the data.
Peak heap memory is the maximum memory allocated by the program throughout its execution. The memory allocator may reuse memory freed by previous destructors,
delandfreecalls, reducing the number of system calls and maximum memory allocated.RSS is the Resident Set Size, which is the amount of physical memory occupied by the process.
Total memory leak refers to memory allocated but never freed. This includes static initialization, so it is not uncommon to be different than 0KB. However this does not mean the program does not have memory leaks. Other memory profilers such as Valgrind and memory sanitizers are better suited to track down memory leaks.
Based on the stack trace, it is fairly easy to locate the corresponding code and act on it to reduce the number of allocations.
In the case of ns3::QueueDisc::DropBeforeEnqueue shown above, the
allocations were caused by the transformation of C strings (char*) into C++ strings
(std::string) before performing the search in ns3::QueueDisc::Stats maps.
These unnecessary allocations were prevented by making use of the transparent
comparator std::less<>, part of merge request MR830.
Heaptrack also has a GUI that provides the same information printed by the command line interface, but in a more interactive way.
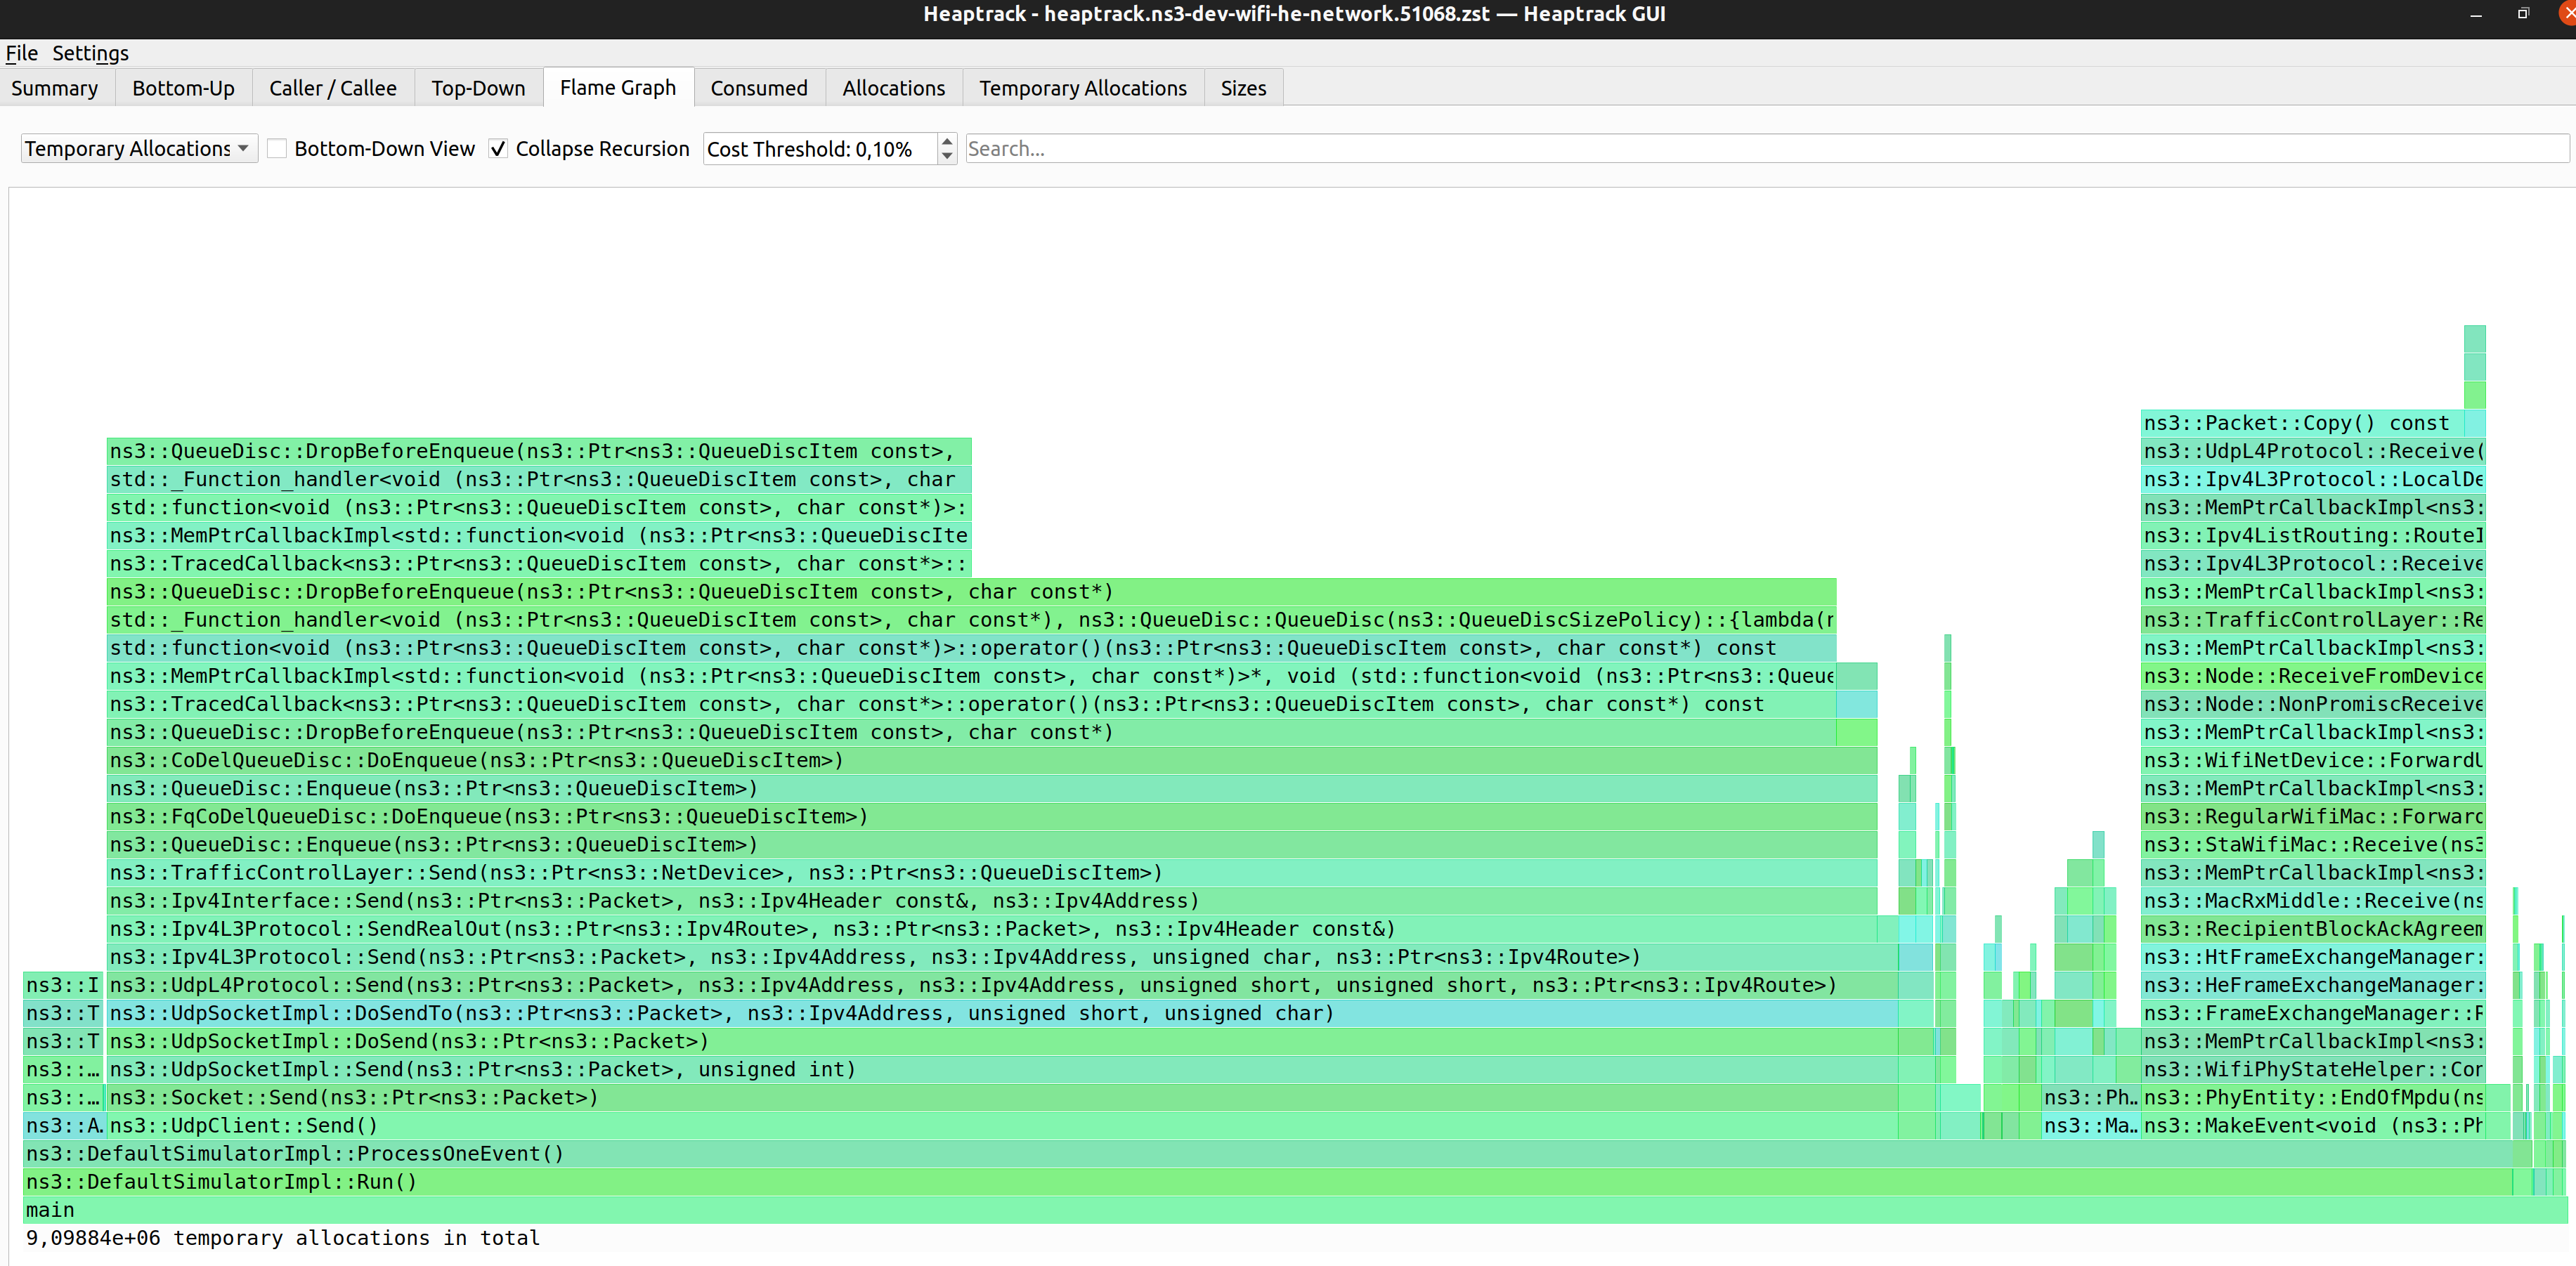
Heaptrack was used in merge request MR830 to track and reduce the number of allocations
in the wifi-he-network example mentioned above. About 29 million unnecessary allocations
were removed, which translates to a 20% reduction. This resulted in a 1.07x speedup of the
test suite with Valgrind (./test.py -d -g) and 1.02x speedup without it.
Memray
Memray is an utility made by Bloomberg to trace memory allocations of Python programs, including native code called by them. Along with stack traces, developers can trace down possible memory leaks and unnecessary allocations.
Note: Memray is ineffective for profiling the ns-3 python bindings since Cppyy hides away the calls to the ns-3 module libraries. However, it is still useful for python scripts in general, for example ones used to parse and consolidate simulation results.
The ns3 script includes a run option to launch Python programs with Memray.
Memray can produce different types of reports, such as a flamegraph in HTML, or
text reports (summary and stats).
~/ns-3-dev/$ ./ns3 run sample-rng-plot.py --memray
Writing profile results into memray.output
Memray WARNING: Correcting symbol for aligned_alloc from 0x7fd97023c890 to 0x7fd97102fce0
[memray] Successfully generated profile results.

You can now generate reports from the stored allocation records.
Some example commands to generate reports:

/usr/bin/python3 -m memray flamegraph memray.output
~/ns-3-dev$ /usr/bin/python3 -m memray stats memray.output
   Total allocations:
         5364235

   Total memory allocated:
         10.748GB

   Histogram of allocation size:
         min: 0.000B
         ----------------------------------------------
         < 8.000B   :  264149 |||
         < 78.000B  : 2051906 |||||||||||||||||||||||
         < 699.000B : 2270941 |||||||||||||||||||||||||
         < 6.064KB  :  608993 |||||||
         < 53.836KB :  165307 ||
         < 477.912KB:    2220 |
         < 4.143MB  :     511 |
         < 36.779MB :     188 |
         < 326.492MB:      19 |
         <=2.830GB  :       1 |
         ----------------------------------------------
         max: 2.830GB

   Allocator type distribution:
          MALLOC: 4647765
          CALLOC: 435525
          REALLOC: 277736
          POSIX_MEMALIGN: 2686
          MMAP: 523

   Top 5 largest allocating locations (by size):
         - include:/usr/local/lib/python3.10/dist-packages/cppyy/__init__.py:243 -> 8.814GB
         - <stack trace unavailable> -> 746.999MB
         - show:~/.local/lib/python3.10/site-packages/matplotlib/backends/backend_gtk4.py:340 -> 263.338MB
         - load_library:/usr/local/lib/python3.10/dist-packages/cppyy/__init__.py:235 -> 245.684MB
         - __init__:/usr/lib/python3.10/ctypes/__init__.py:374 -> 225.797MB

   Top 5 largest allocating locations (by number of allocations):
         - include:/usr/local/lib/python3.10/dist-packages/cppyy/__init__.py:243 -> 2246145
         - show:~/.local/lib/python3.10/site-packages/matplotlib/backends/backend_gtk4.py:340 -> 1264614
         - <stack trace unavailable> -> 1098543
         - __init__:~/.local/lib/python3.10/site-packages/matplotlib/backends/backend_gtk4.py:61 -> 89466
         - run:/usr/lib/python3/dist-packages/gi/overrides/Gio.py:42 -> 79582
Performance Profilers
Performance profilers are programs that collect runtime information and help to identify performance bottlenecks. In some cases, they can point out hotspots and suggest solutions.
There are many tools to profile your program, including:
profilers from CPU manufacturers, such as AMD uProf and Intel VTune
profilers from the operating systems, such as Linux’s Perf and Windows Performance Toolkit
instrumented compilation and auxiliary tools provided by compilers, such as Gprof
An overview on how to use Perf with Hotspot, AMD uProf and Intel VTune is provided in the following sections.
Linux Perf and Hotspot GUI
Perf is the kernel tool to measure performance of the Linux kernel, drivers and user-space applications.
Perf tracks some performance events, being some of the most important for performance:
cycles
Clocks (time) spent running.
cache-misses
When either data or instructions were not in the L1/L2 caches, requiring a L3 or memory access.
branch-misses
How many branch instructions were mispredicted. Mispredictions causes the CPU to stall and clean the pipeline, slowing down the program.
stalled-cycles-frontend
Cycles wasted by the processor waiting for the next instruction, usually due to instruction cache miss or mispredictions. Starves the CPU pipeline of instructions and slows down the program.
stalled-cycles-backend
Cycles wasted waiting for pipeline resources to finish their work. Usually waiting for memory read/write, or executing long-latency instructions.
Just like with heaptrack, perf can be executed using the ns3 wrapper
command template. In the following command we output perf data from wifi-he-network
to the perf.data output file.
~/ns-3-dev$ ./ns3 run "wifi-he-network --simulationTime=0.3 --frequency=5 --useRts=1 --minExpectedThroughput=6 --maxExpectedThroughput=745" --command-template "perf record -o ./perf.data --call-graph dwarf --event cycles,cache-misses,branch-misses --sample-cpu %s" --no-build
For ease of use, ns3 also provides the --perf run option, that
include the recommended settings.
~/ns-3-dev$ ./ns3 run "wifi-he-network --simulationTime=0.3 --frequency=5 --useRts=1 --minExpectedThroughput=6 --maxExpectedThroughput=745" --perf --no-build
When running for the first time, you may receive the following error:
~/ns-3-dev$ ./ns3 run "wifi-he-network --simulationTime=0.3 --frequency=5 --useRts=1 --minExpectedThroughput=6 --maxExpectedThroughput=745" --perf --no-build
Error:
Access to performance monitoring and observability operations is limited.
Consider adjusting /proc/sys/kernel/perf_event_paranoid setting to open
access to performance monitoring and observability operations for processes
without CAP_PERFMON, CAP_SYS_PTRACE or CAP_SYS_ADMIN Linux capability.
More information can be found at 'Perf events and tool security' document:
https://www.kernel.org/doc/html/latest/admin-guide/perf-security.html
perf_event_paranoid setting is 1:
  -1: Allow use of (almost) all events by all users
      Ignore mlock limit after perf_event_mlock_kb without CAP_IPC_LOCK
>= 0: Disallow raw and ftrace function tracepoint access
>= 1: Disallow CPU event access
>= 2: Disallow kernel profiling
To make the adjusted perf_event_paranoid setting permanent preserve it
in /etc/sysctl.conf (e.g. kernel.perf_event_paranoid = <setting>)
Command 'build/examples/wireless/ns3-dev-wifi-he-network-default record --call-graph dwarf -a -e cache-misses,branch-misses,cpu-cycles,instructions,context-switches build/examples/wireless/ns3-dev-wifi-he-network-default -n=100' returned non-zero exit status 255.
This error is related to lacking permissions to access performance events from the kernel and CPU.
As said in the error, permissions can be granted for the current session
by changing the perf_event_paranoid setting with echo 0 > /proc/sys/kernel/perf_event_paranoid.
This change can be made permanent by changing the setting in /etc/sysctl.conf, but
this is not recommended. Administrative permissions (sudo su) are required in both cases.
After the program finishes, it will print recording statistics.
MCS value               Channel width           GI                      Throughput
0                       20 MHz                  3200 ns                 6.01067 Mbit/s
0                       20 MHz                  1600 ns                 5.936 Mbit/s
...
11                      160 MHz                 1600 ns                 493.397 Mbit/s
11                      160 MHz                 800 ns                  534.016 Mbit/s
[ perf record: Woken up 9529 times to write data ]
Warning:
Processed 517638 events and lost 94 chunks!

Check IO/CPU overload!

Warning:
1 out of order events recorded.
[ perf record: Captured and wrote 2898,307 MB perf.data (436509 samples) ]
Results saved in perf.data can be reviewed with the perf report command.
Hotspot is a GUI for Perf, that makes performance profiling more
enjoyable and productive. It can parse the perf.data and show in
a more friendly way.
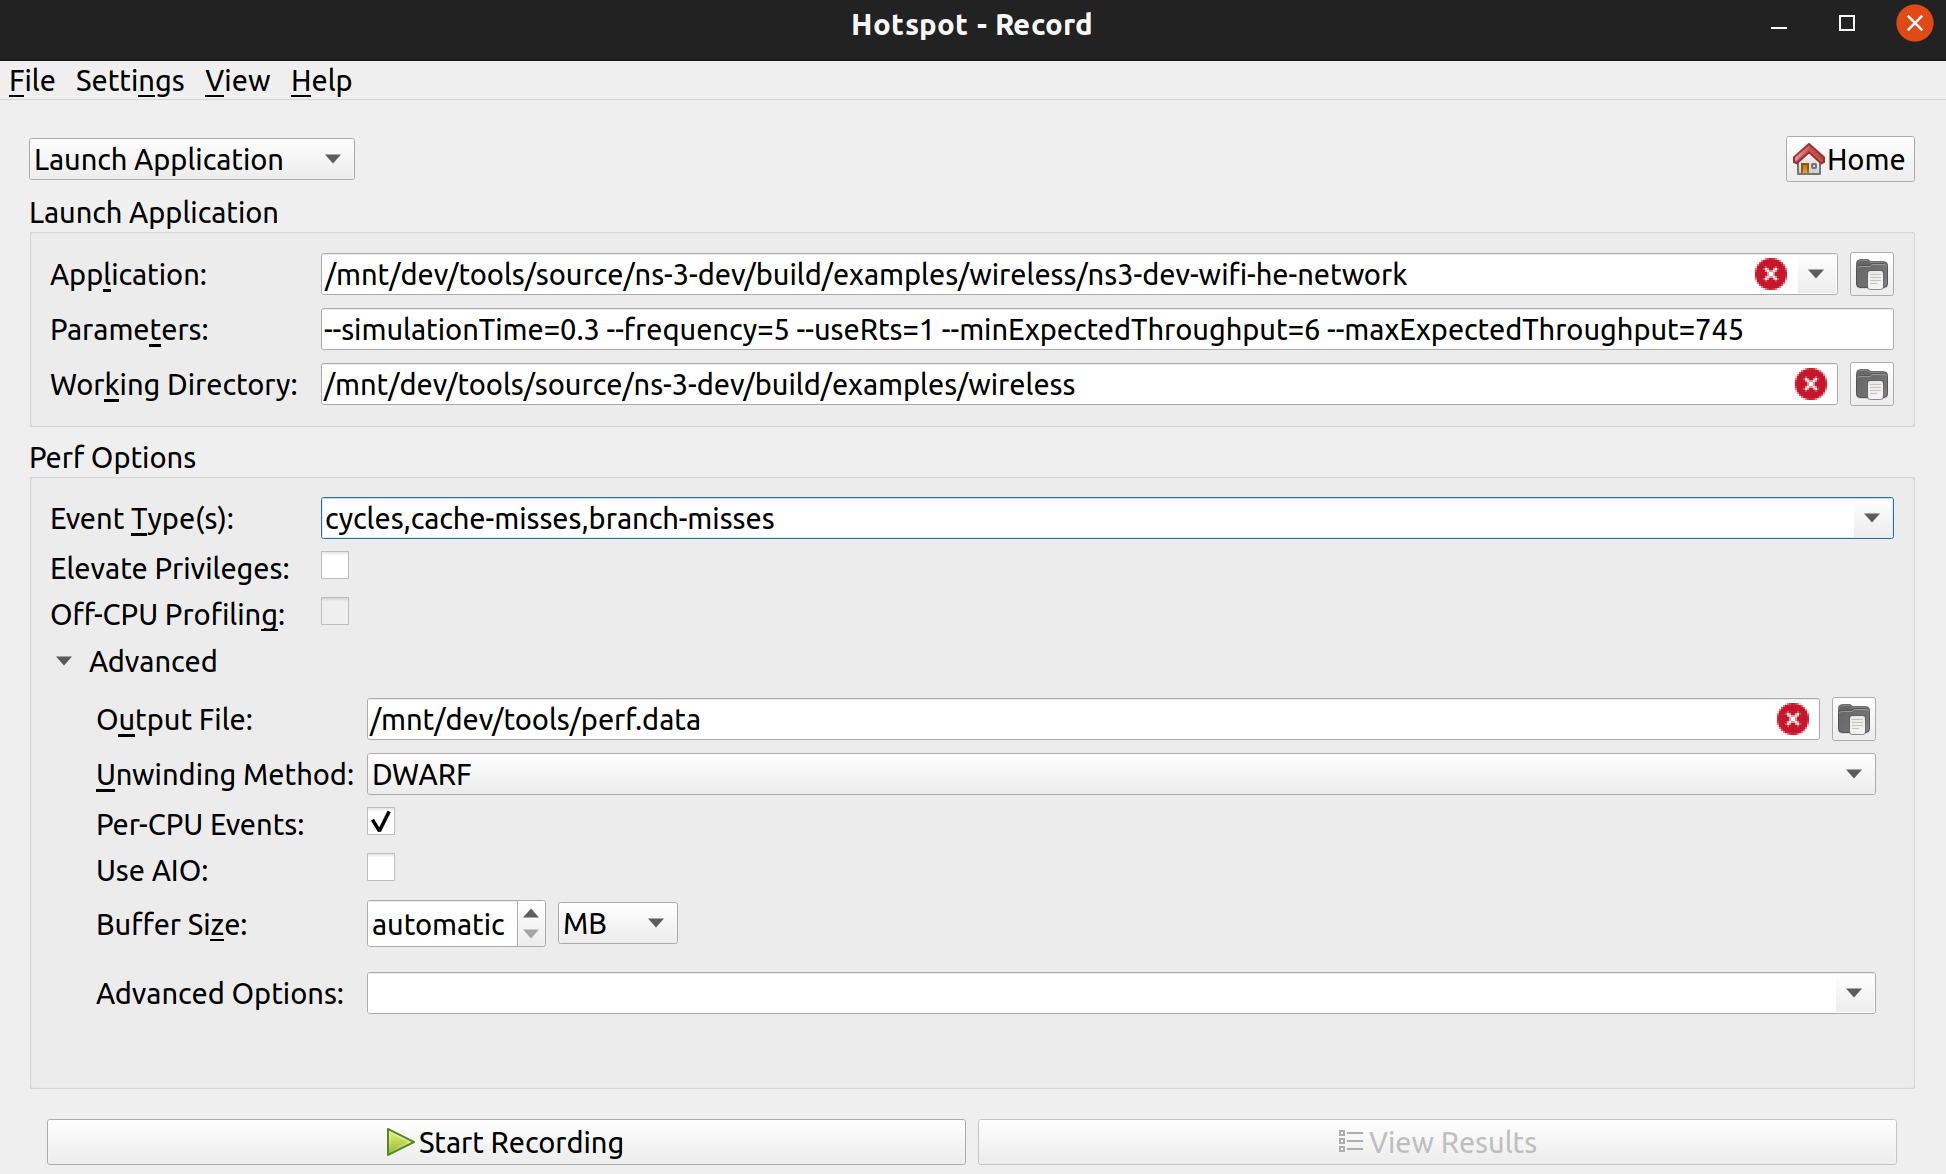
To record the same perf.data from Hotspot directly, fill the fields
for working directory, path to the executable, arguments, perf
events to track and output directory for the perf.data.
Then run to start recording.
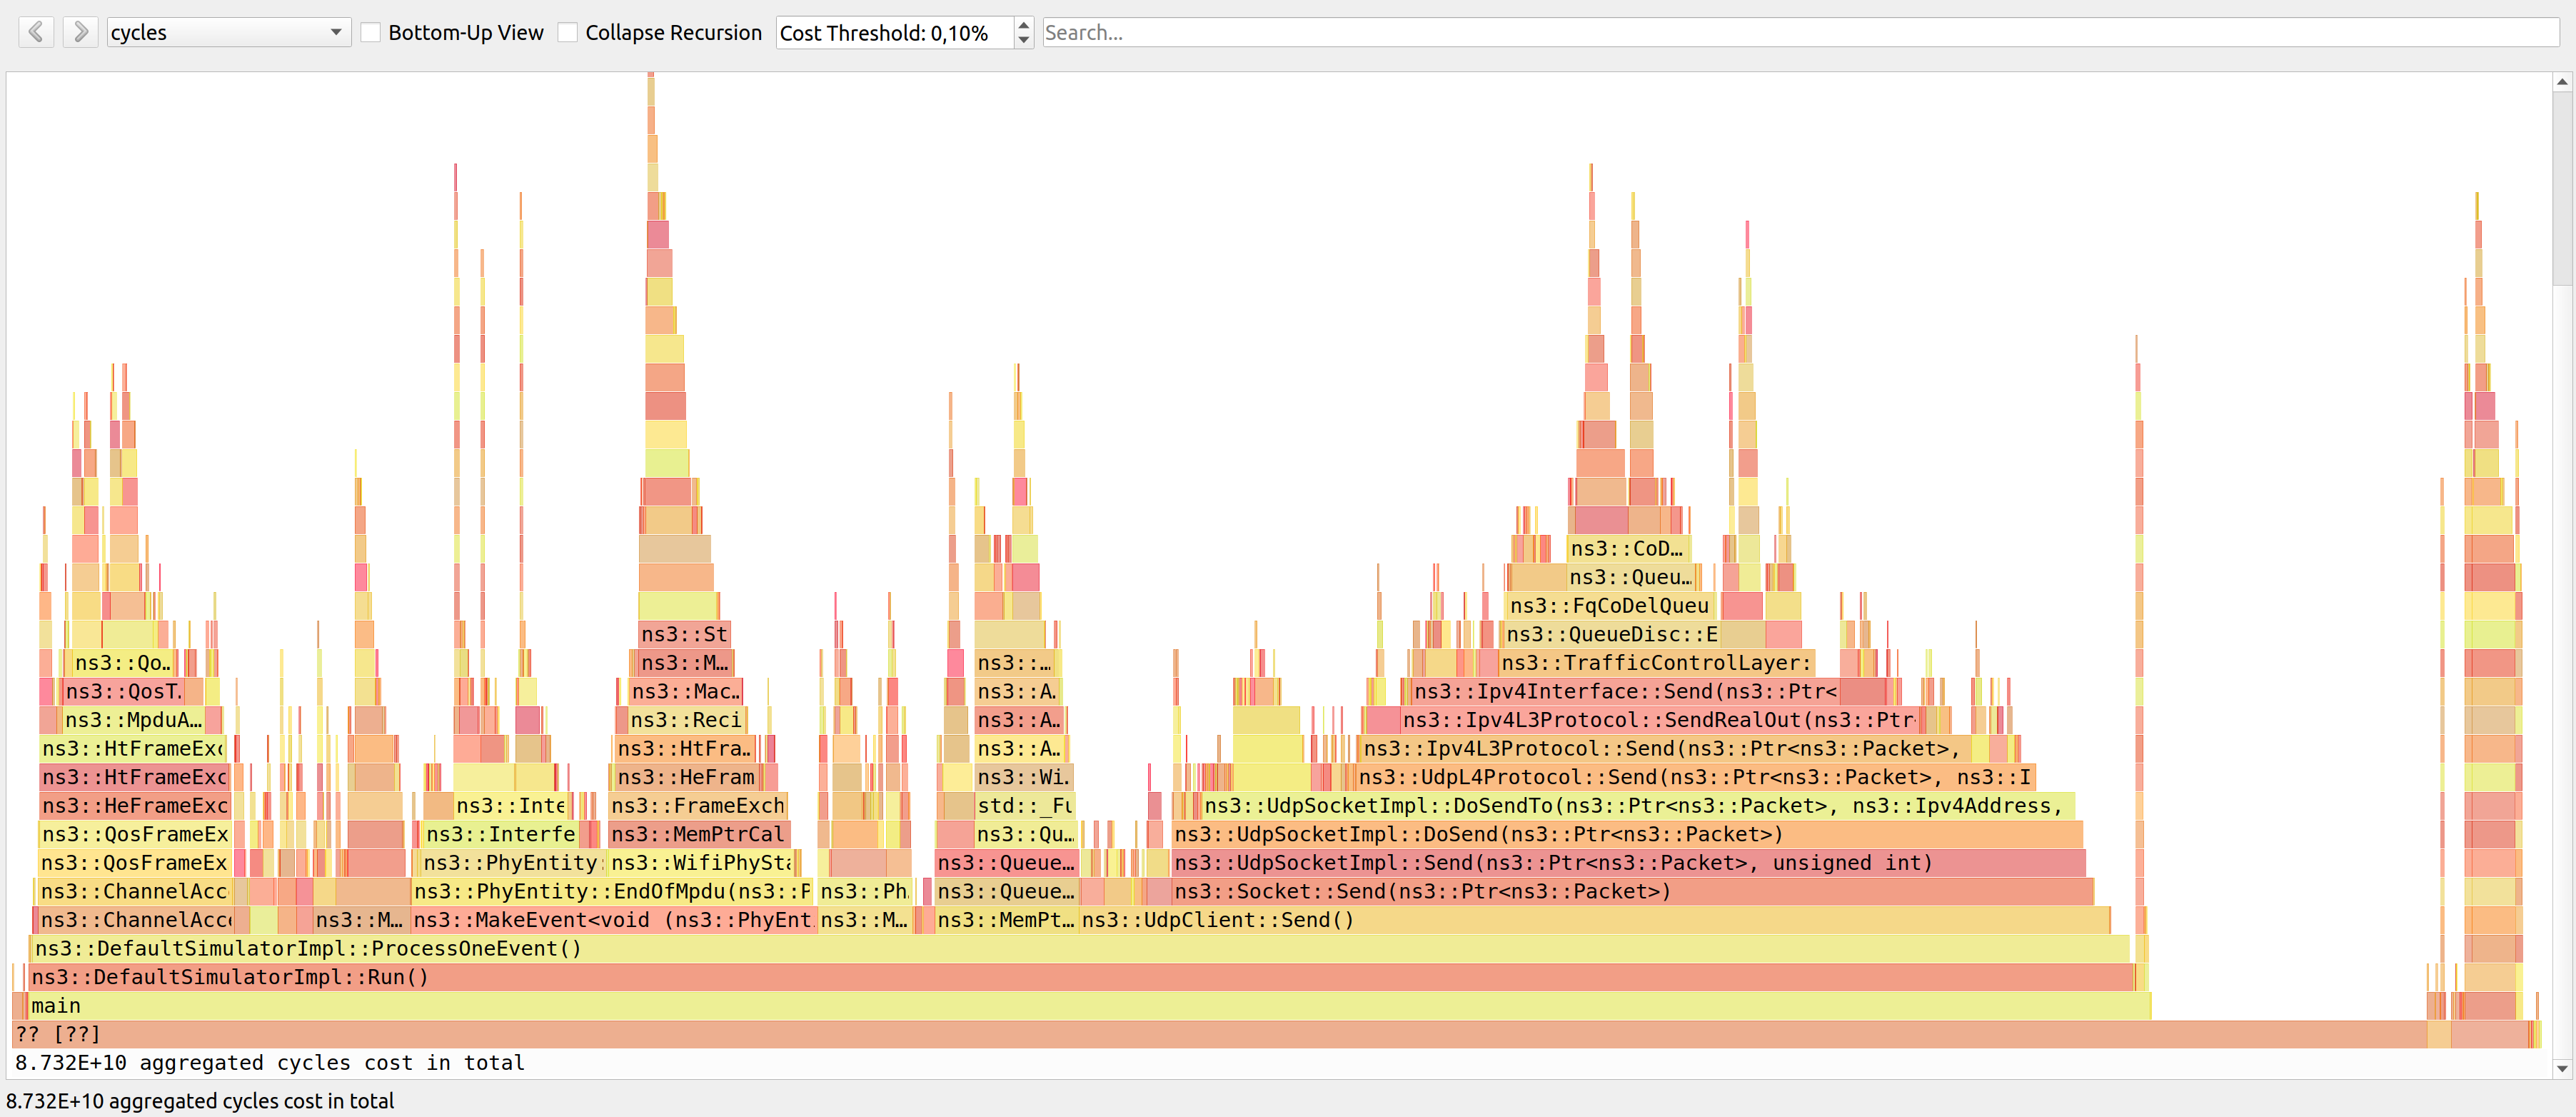
The cycles per function for this program is shown in the following image.
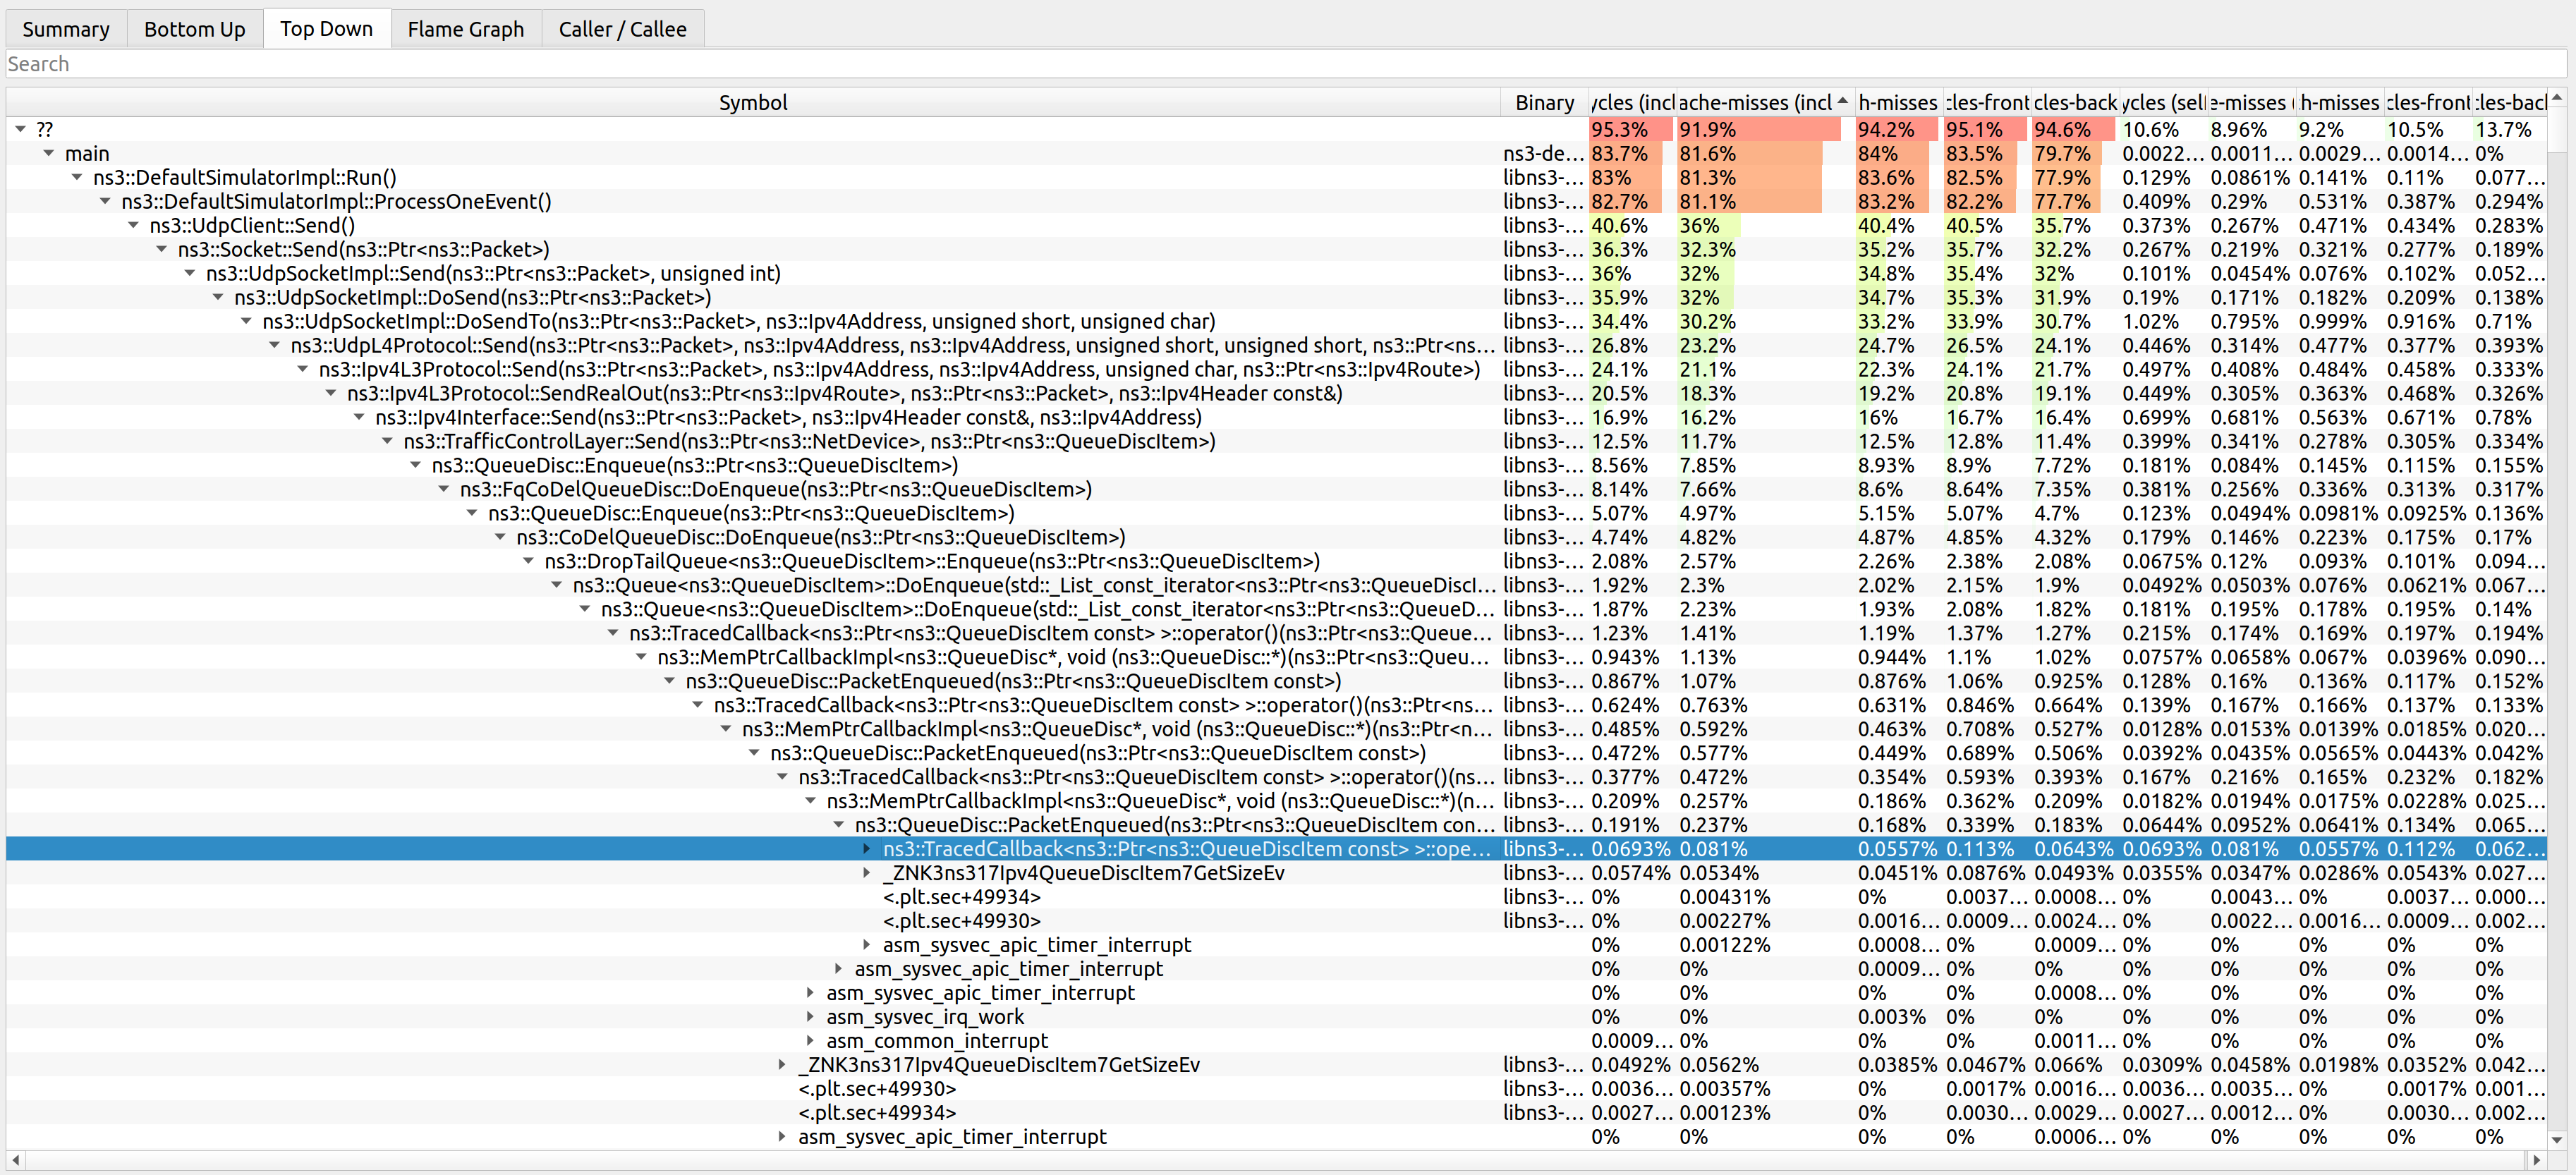
The data is also presented in a tabular format in the bottom-up, top-down and caller/callee tabs (top left of the screen).
Hotspot was used to identify performance bottlenecks in multiple occasions:
wifi-primary-channelstest suite was extremely slow due to unnecessary RF processing. The adopted solution was to replace the filtering step of the entire channel to just the desired sub-band, and assuming sub-bands are uniformly sized, saving multiplications in the integral used to compute the power of each sub-band. This resulted in a 6x speedup with./ns3 run "test-runner --fullness=TAKES_FOREVER --test-name=wifi-primary-channels". Hotspot was used along with AMD uProf to track this and other bottlenecks in issue 426.WifiMacQueue::TtlExceededdereferenced data out of cache when calling Simulator::Now(). The adopted solution was to move Simulator::Now() out of TtlExceeded and reuse the value and inlining TtlExceeded. This resulted in a ~1.20x speedup with the test suite (./test.py -d). Hotspot was used along with AMD uProf to track this and other bottlenecks in issue 280 and merge request MR681.MpduAggregator and MsduAggregator required an expensive attribute lookup to get the maximum sizes from the RegularWifiMac. Bypassing the attribute lookup reduced cache misses and unnecessary branches. The adopted solution was to move Simulator::Now() out of TtlExceeded and reuse the value and inlining TtlExceeded. This resulted in a ~1.02x speedup with the test suite (
./test.py -d). More details on: merge requests MR681 and MR685.
AMD uProf
AMD uProf works much like Linux Perf and Hotspot GUI, but is available in more platforms (Linux, Windows and BSD) using AMD processors. Differently from Perf, it provides more performance trackers for finer analysis.
To use it, open uProf then click to profile an application. If you
have already profile an application, you can reuse those settings for
another application by clicking in one of the items in the Recently Used
Configurations section.
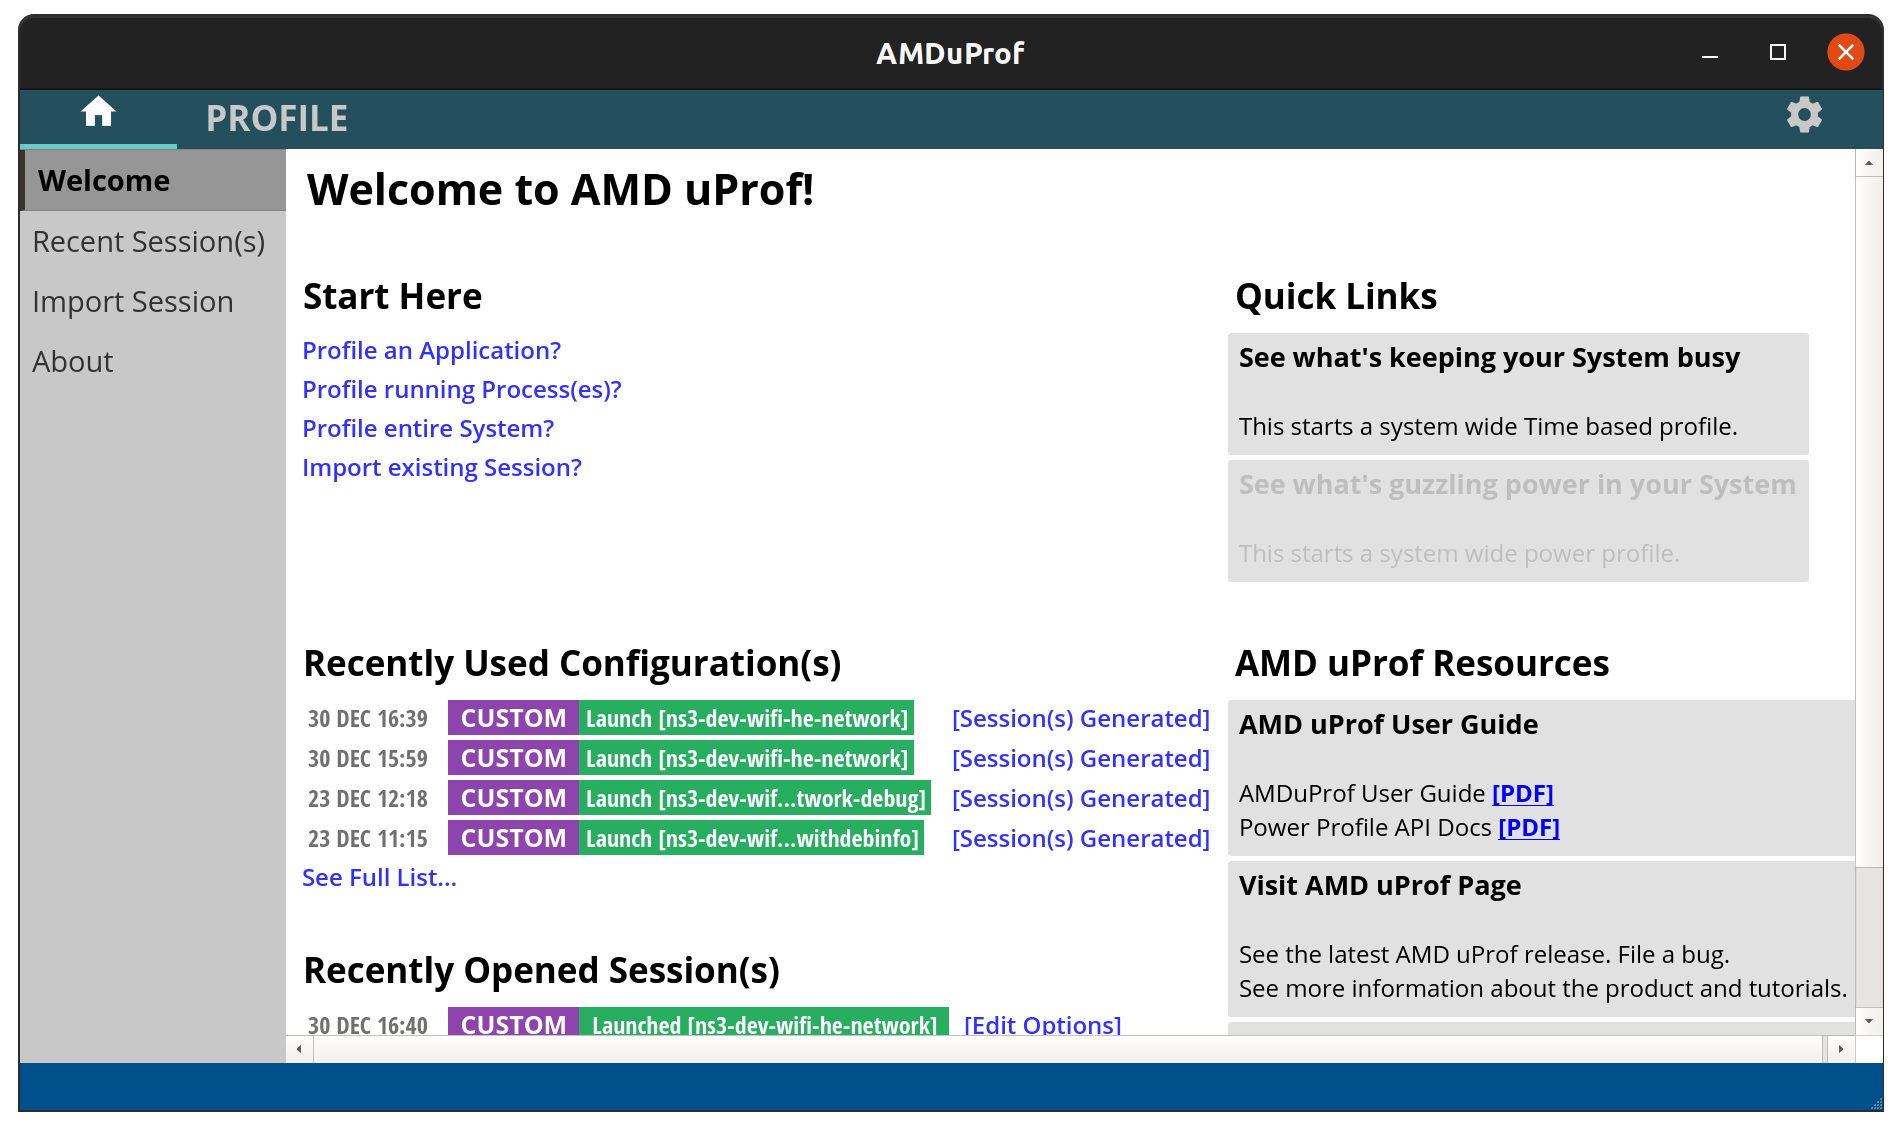
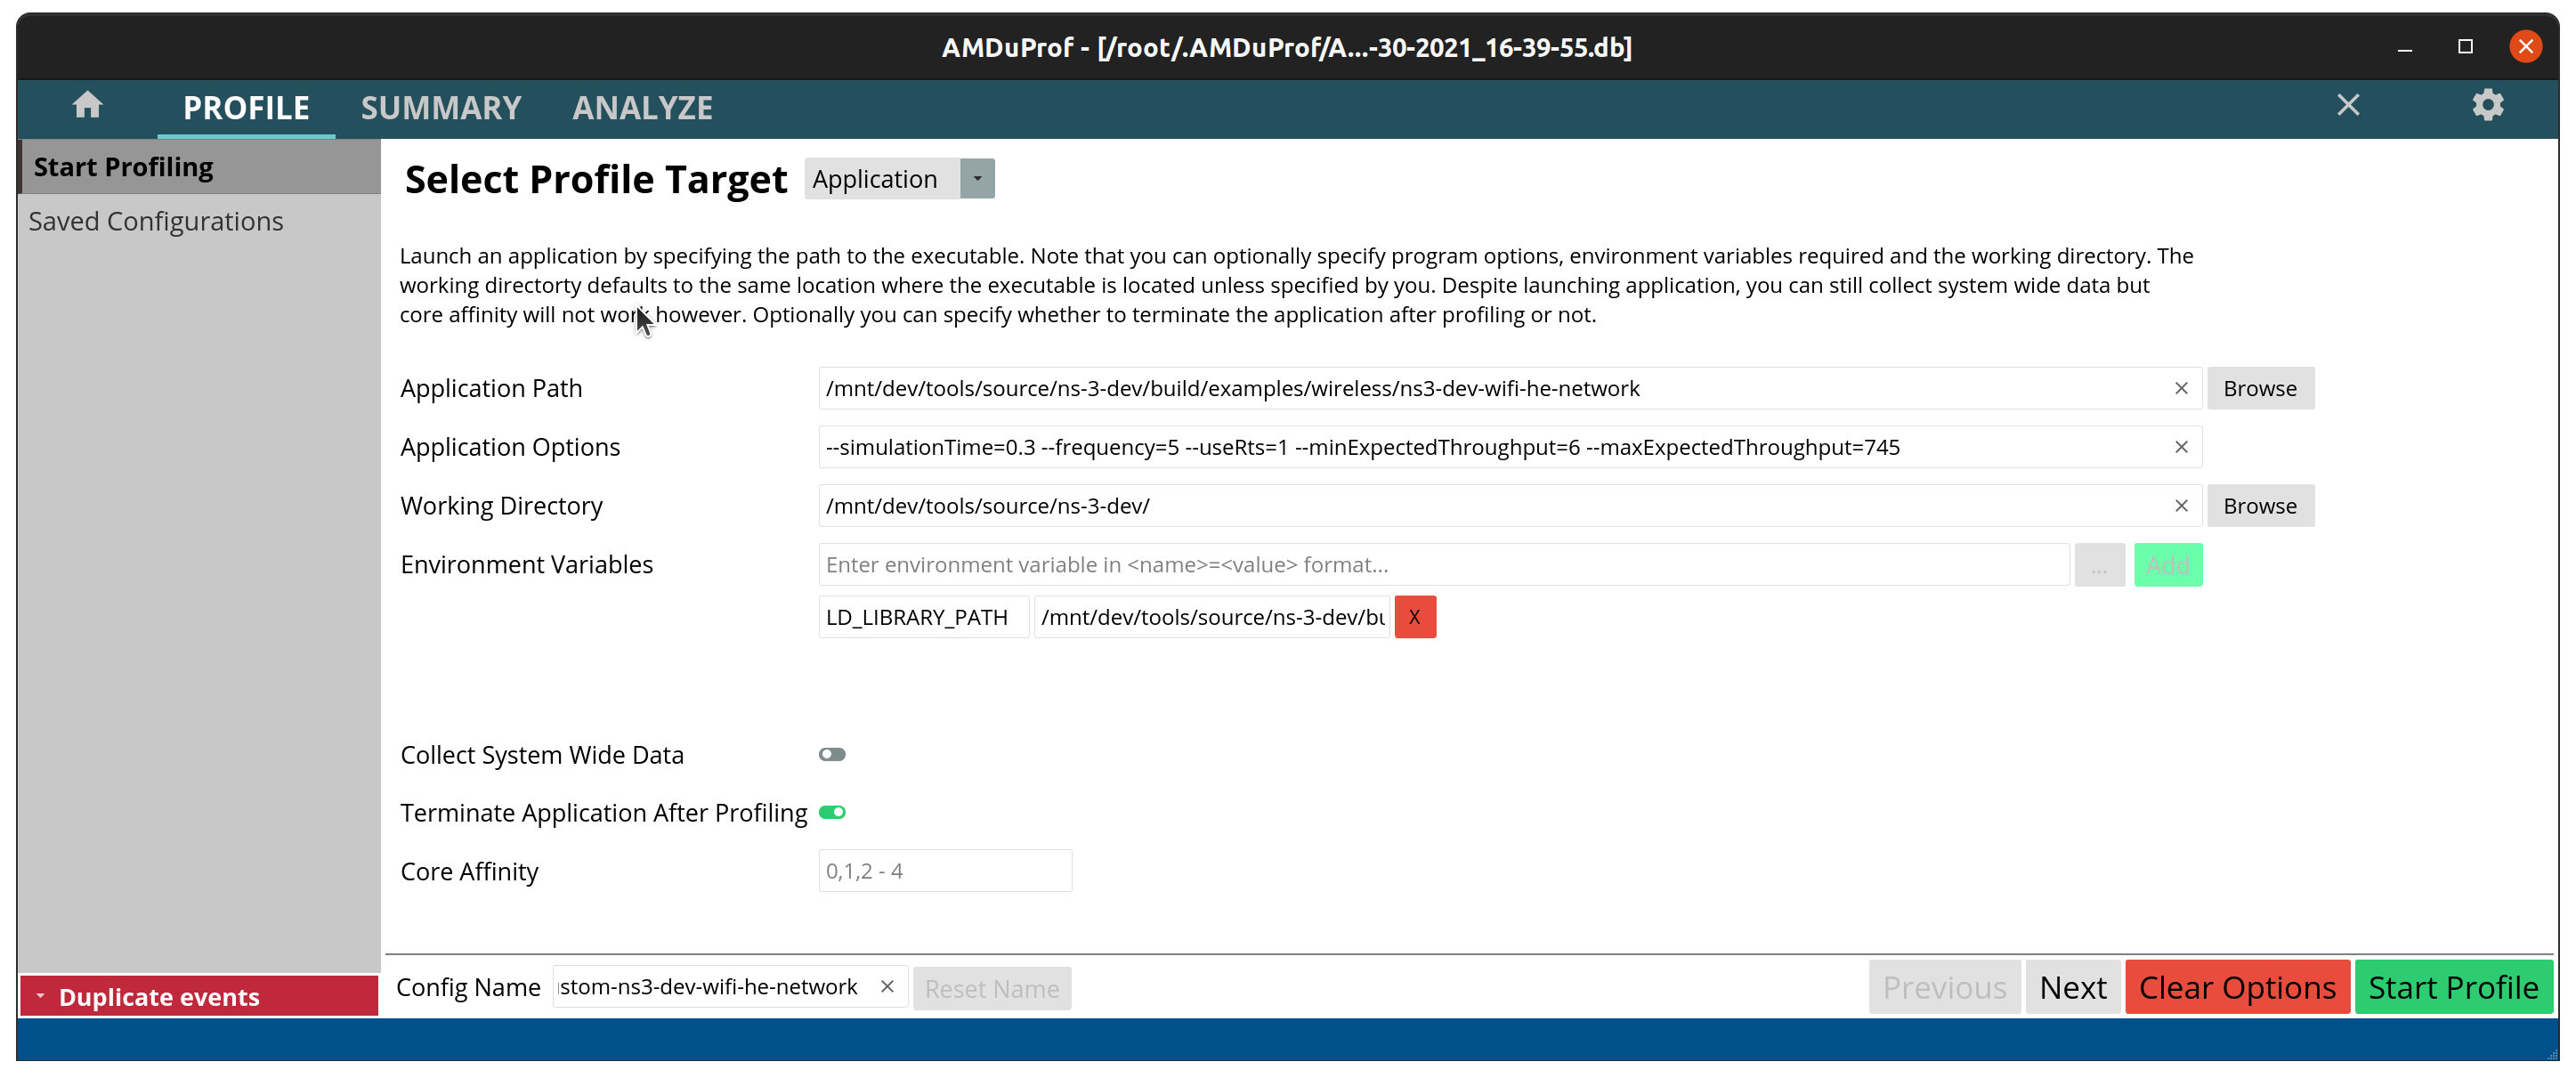
Fill the fields with the application path, the arguments and the working directory.
You may need to add the LD_LIBRARY_PATH environment variable
(or PATH on Windows), pointing it to the library output
directory (e.g. ns-3-dev/build/lib).
Then click next:
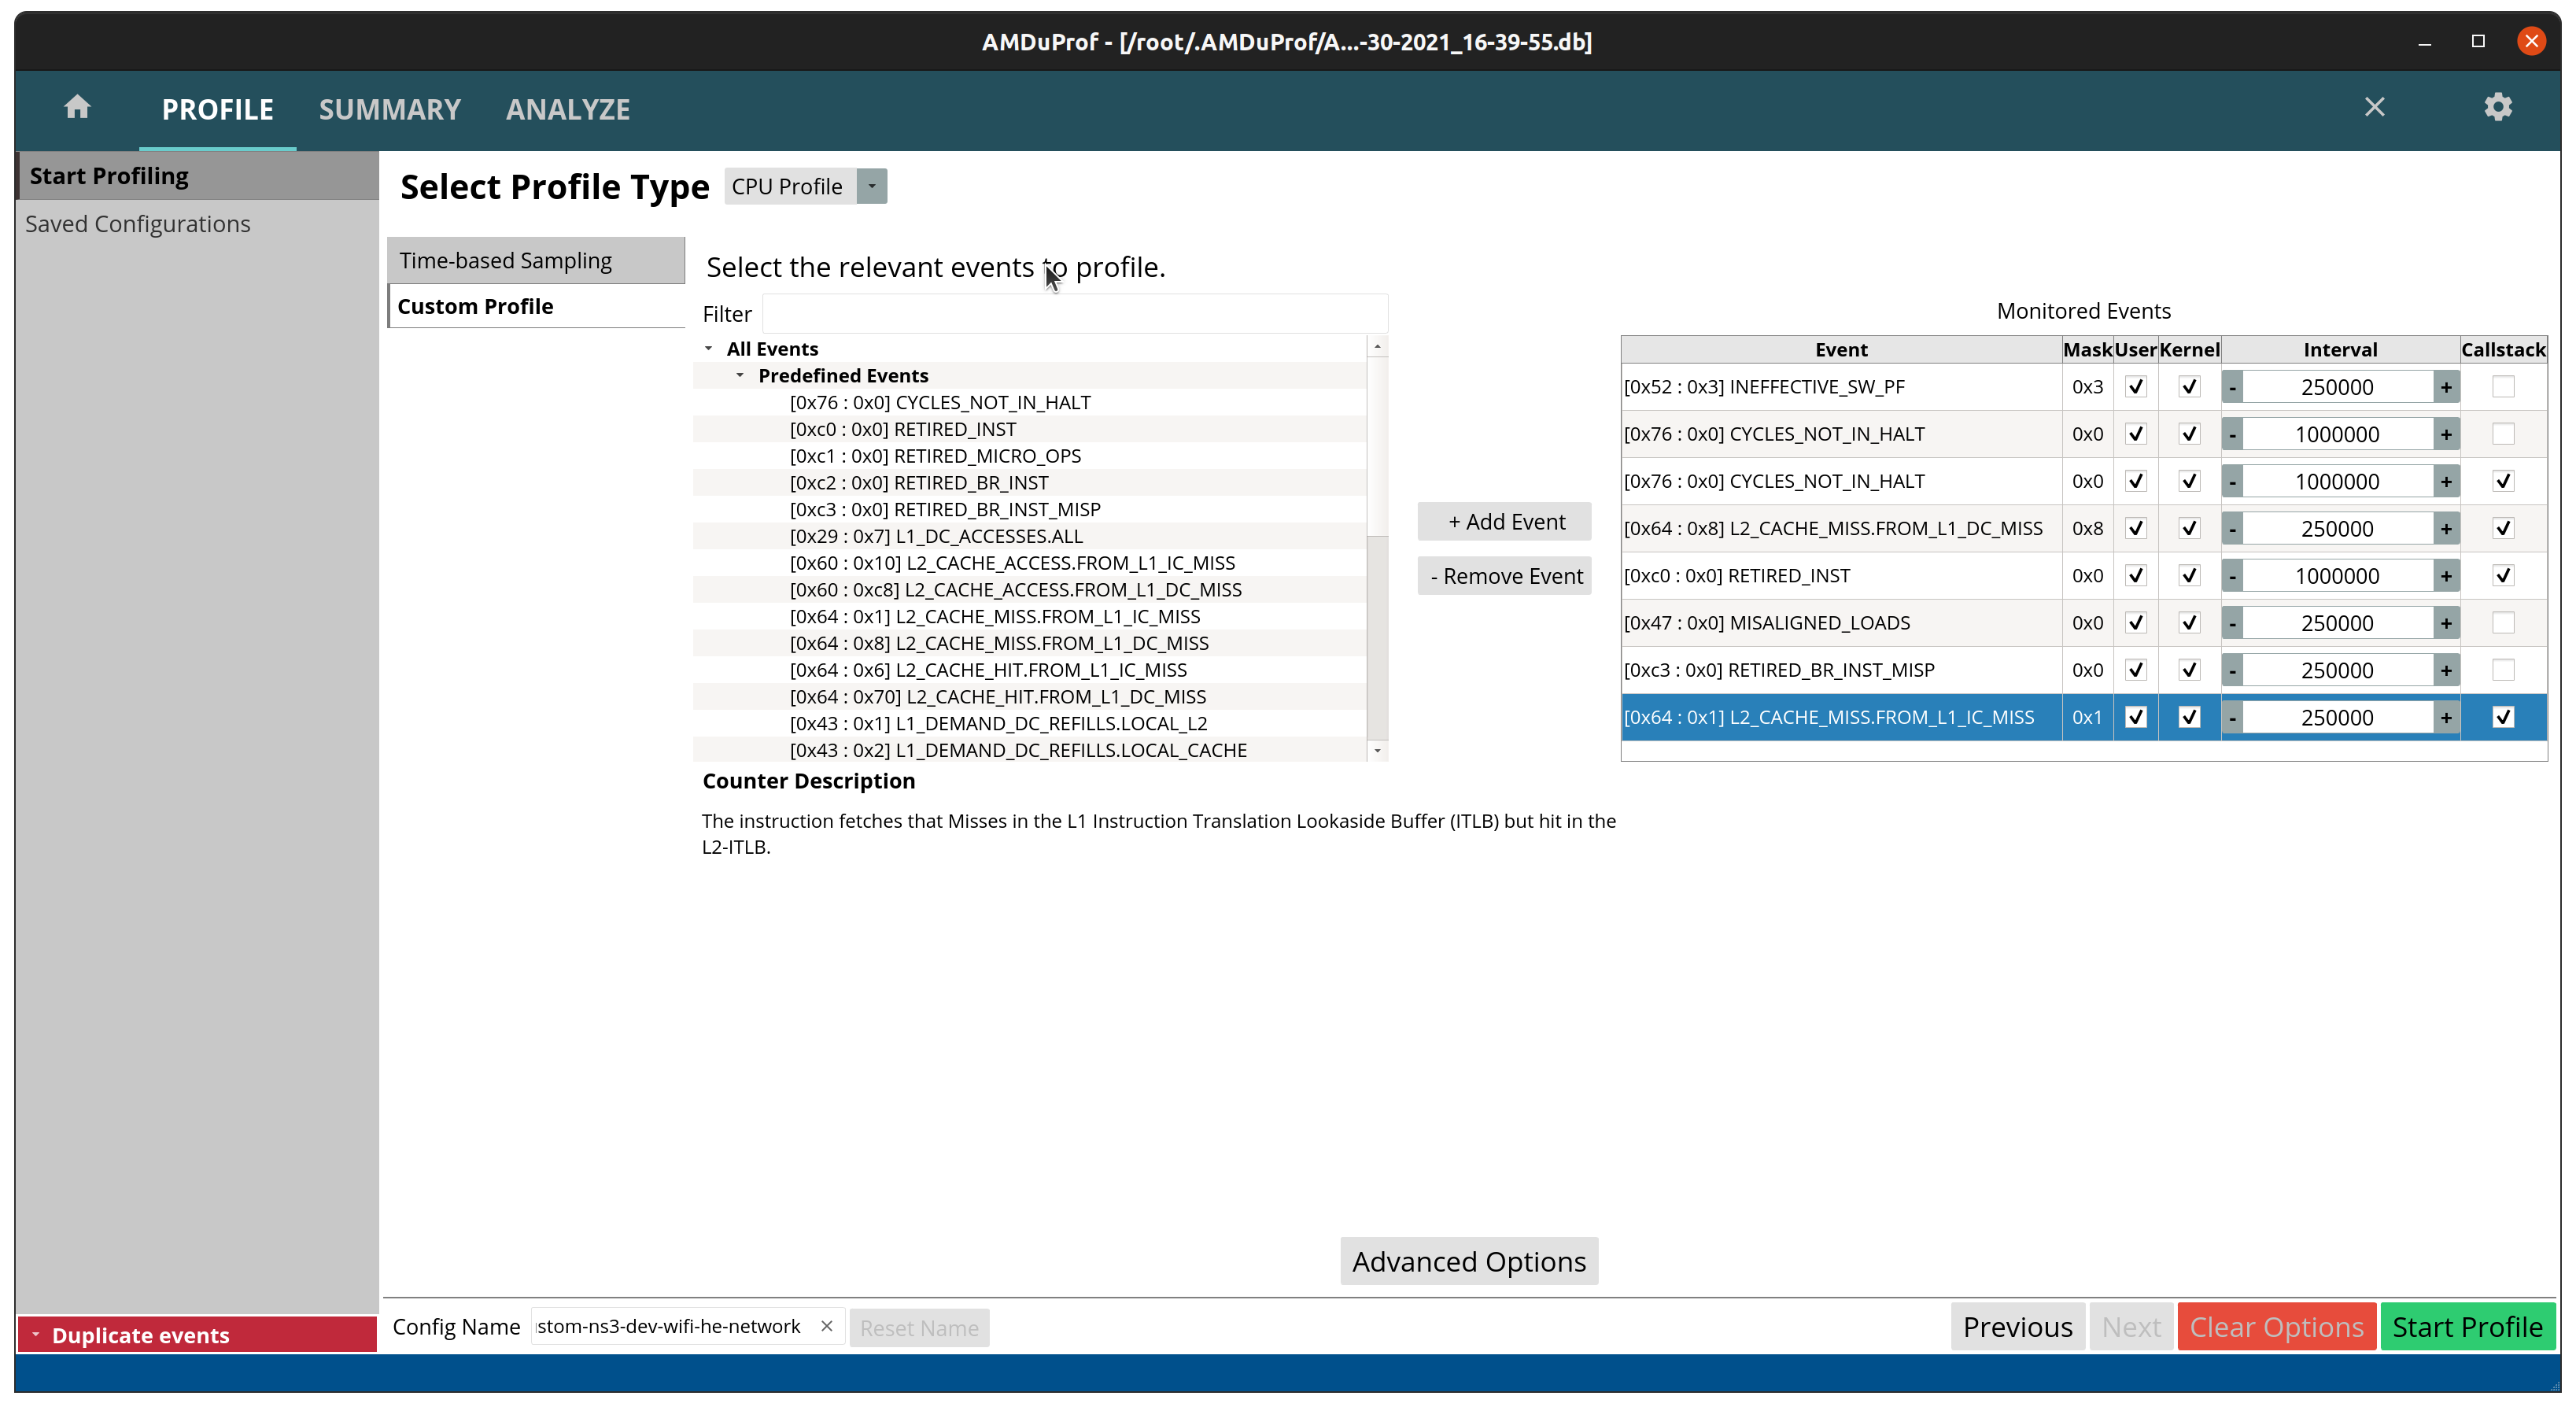
Now select custom events and pick the events you want.
- The recommended ones for performance profiling are:
CYCLES_NOT_IN_HALT
Clocks (time) spent running.
RETIRED_INST
How many instructions were completed.
These do not count mispredictions, stalls, etc.
Instructions per clock (IPC) = RETIRED_INST / CYCLES_NOT_IN_HALT
RETIRED_BR_INST_MISP
How many branch instructions were mispredicted.
Mispredictions causes the CPU to stall and clean the pipeline, slowing down the program.
L2_CACHE_MISS.FROM_L1_IC_MISS
L2 cache misses caused by instruction L1 cache misses.
Results in L3/memory accesses due to missing instructions in L1/L2.
L2_CACHE_MISS.FROM_L1_DC_MISS
L2 cache misses caused by data L1 cache misses.
Results in L3/memory accesses due to missing instructions in L1/L2
MISALIGNED_LOADS
Loads not aligned with processor words.
Might result in additional cache and memory accesses.
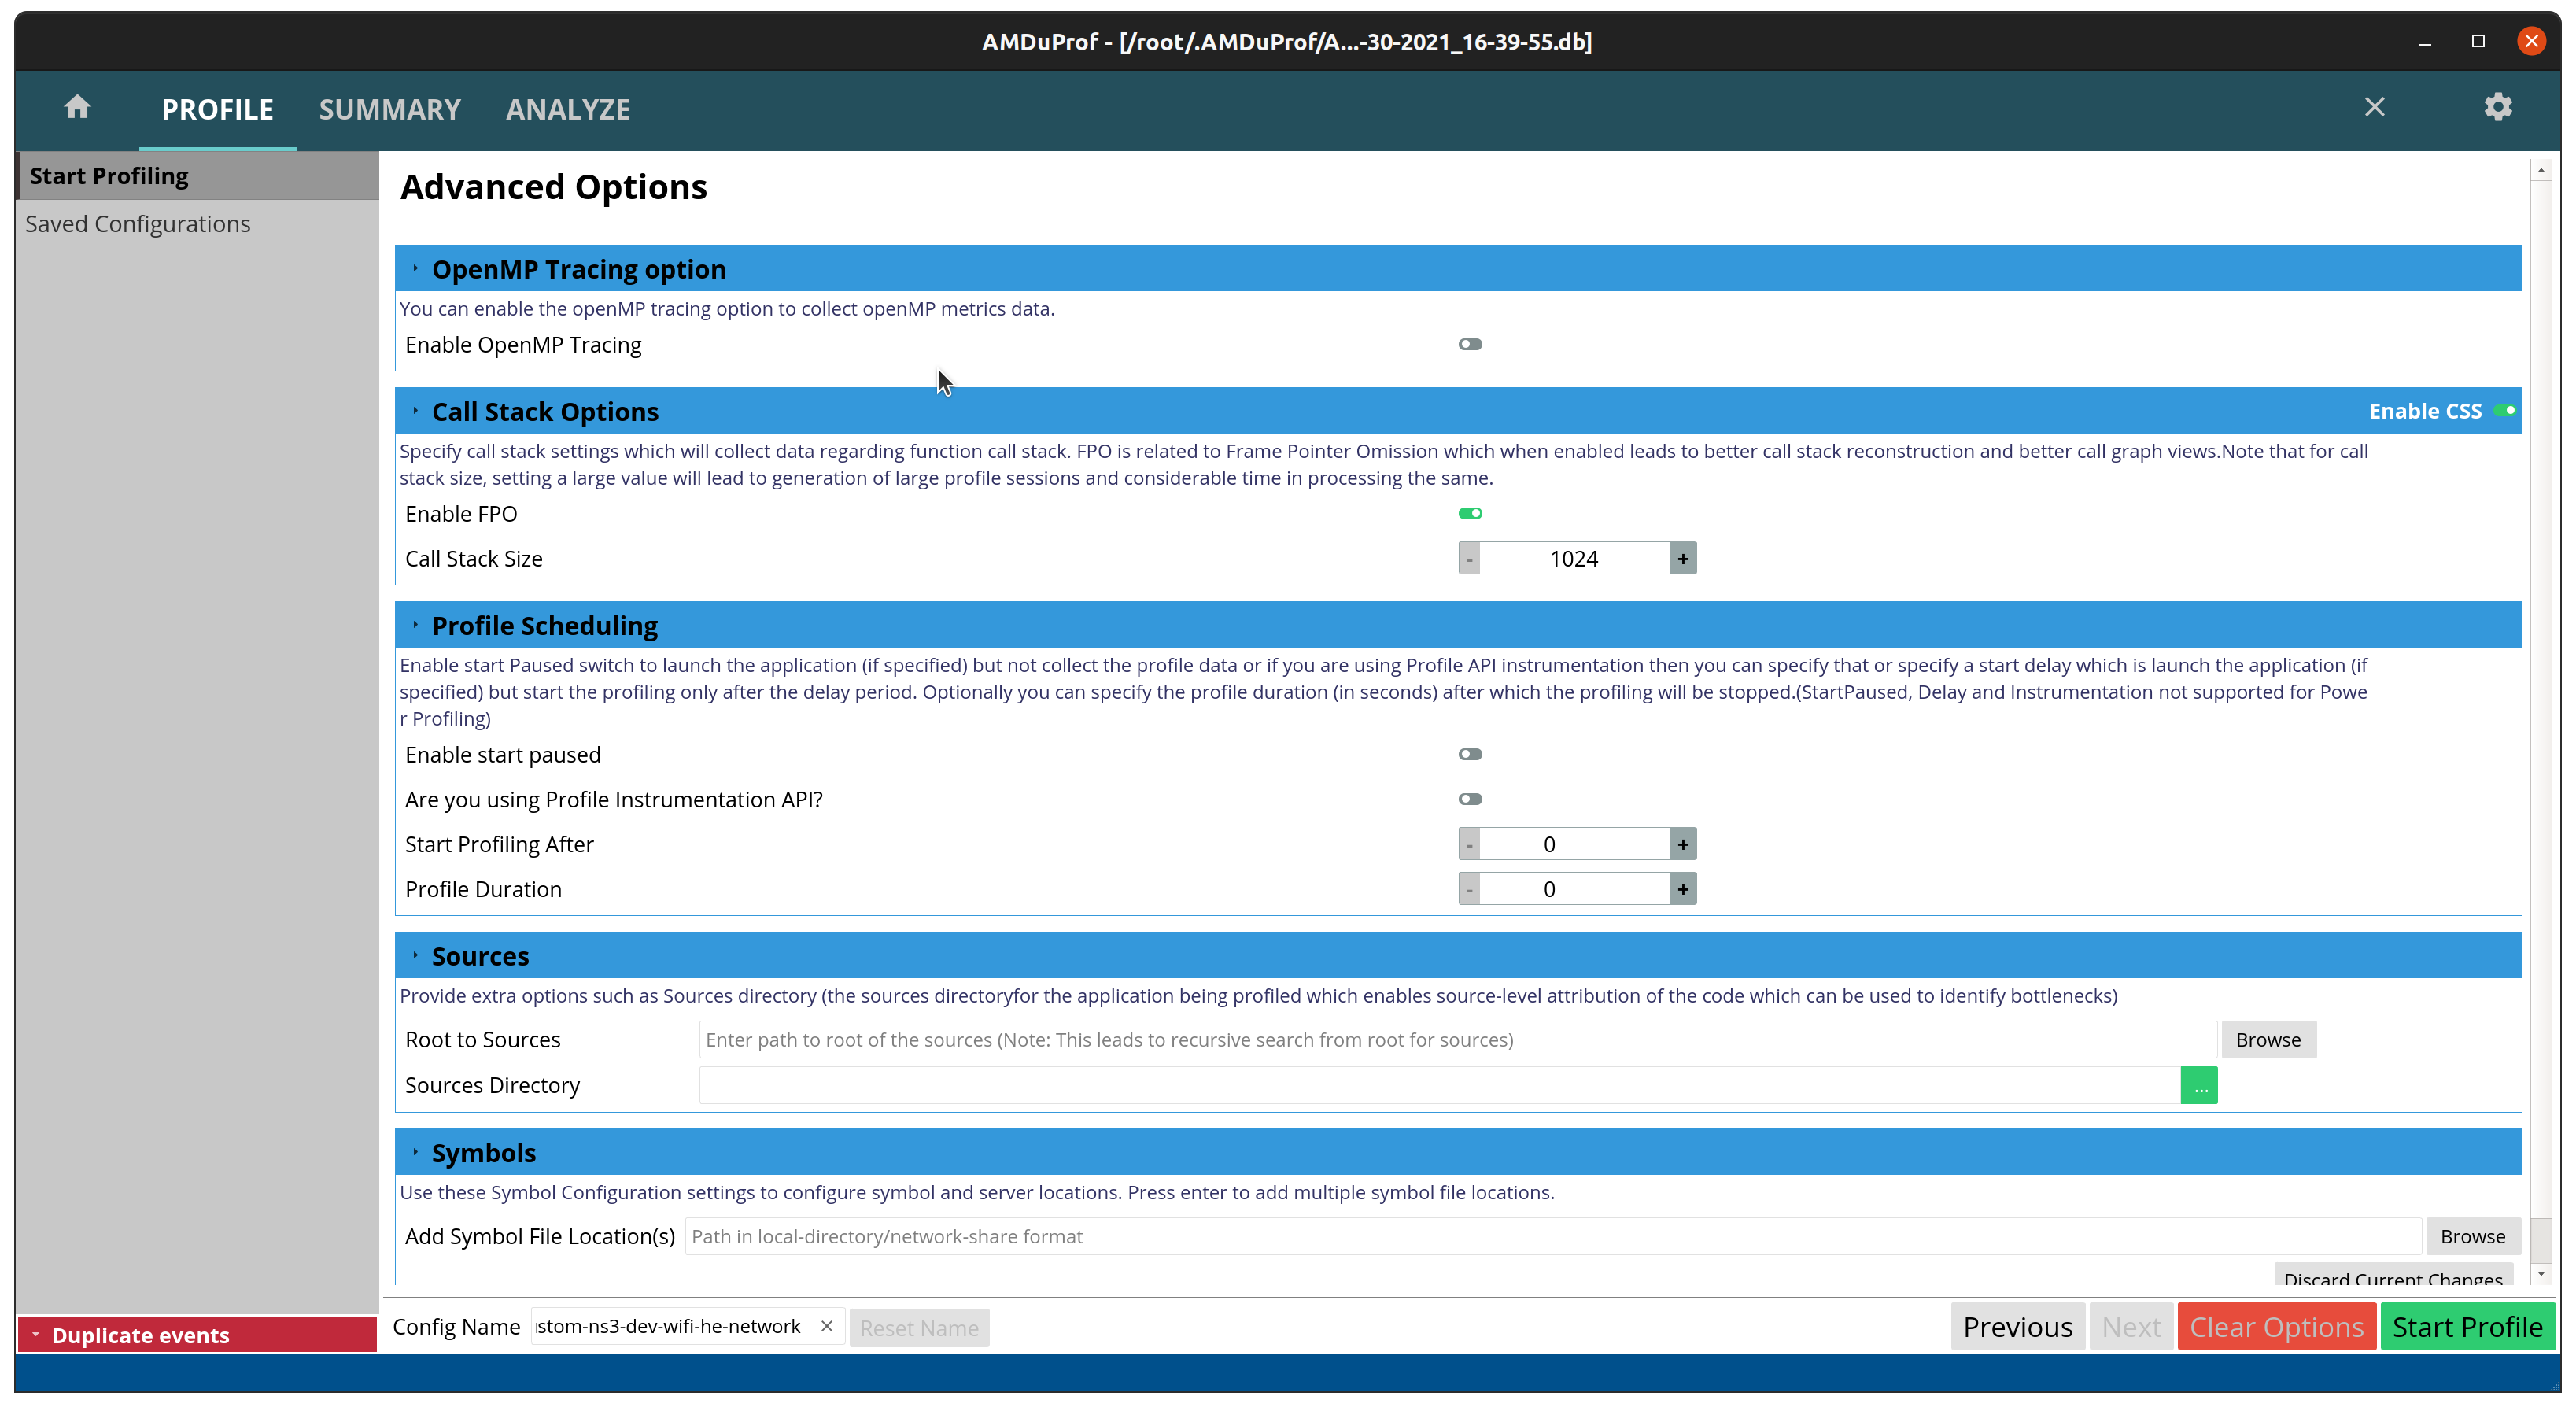
Now click in advanced options to enable collection of the call stack.
Then click Start Profile and wait for the program to end.
After it finishes you will be greeted with a hotspot summary screen,
but the Analyze tab (top of the screen) has sub-tabs with more
relevant information.
In the following image the metrics are shown per module, including the
C library (libc.so.6) which provides the malloc and free functions.
Values can be shown in terms of samples or percentages for easier reading
and to decide where to optimize.
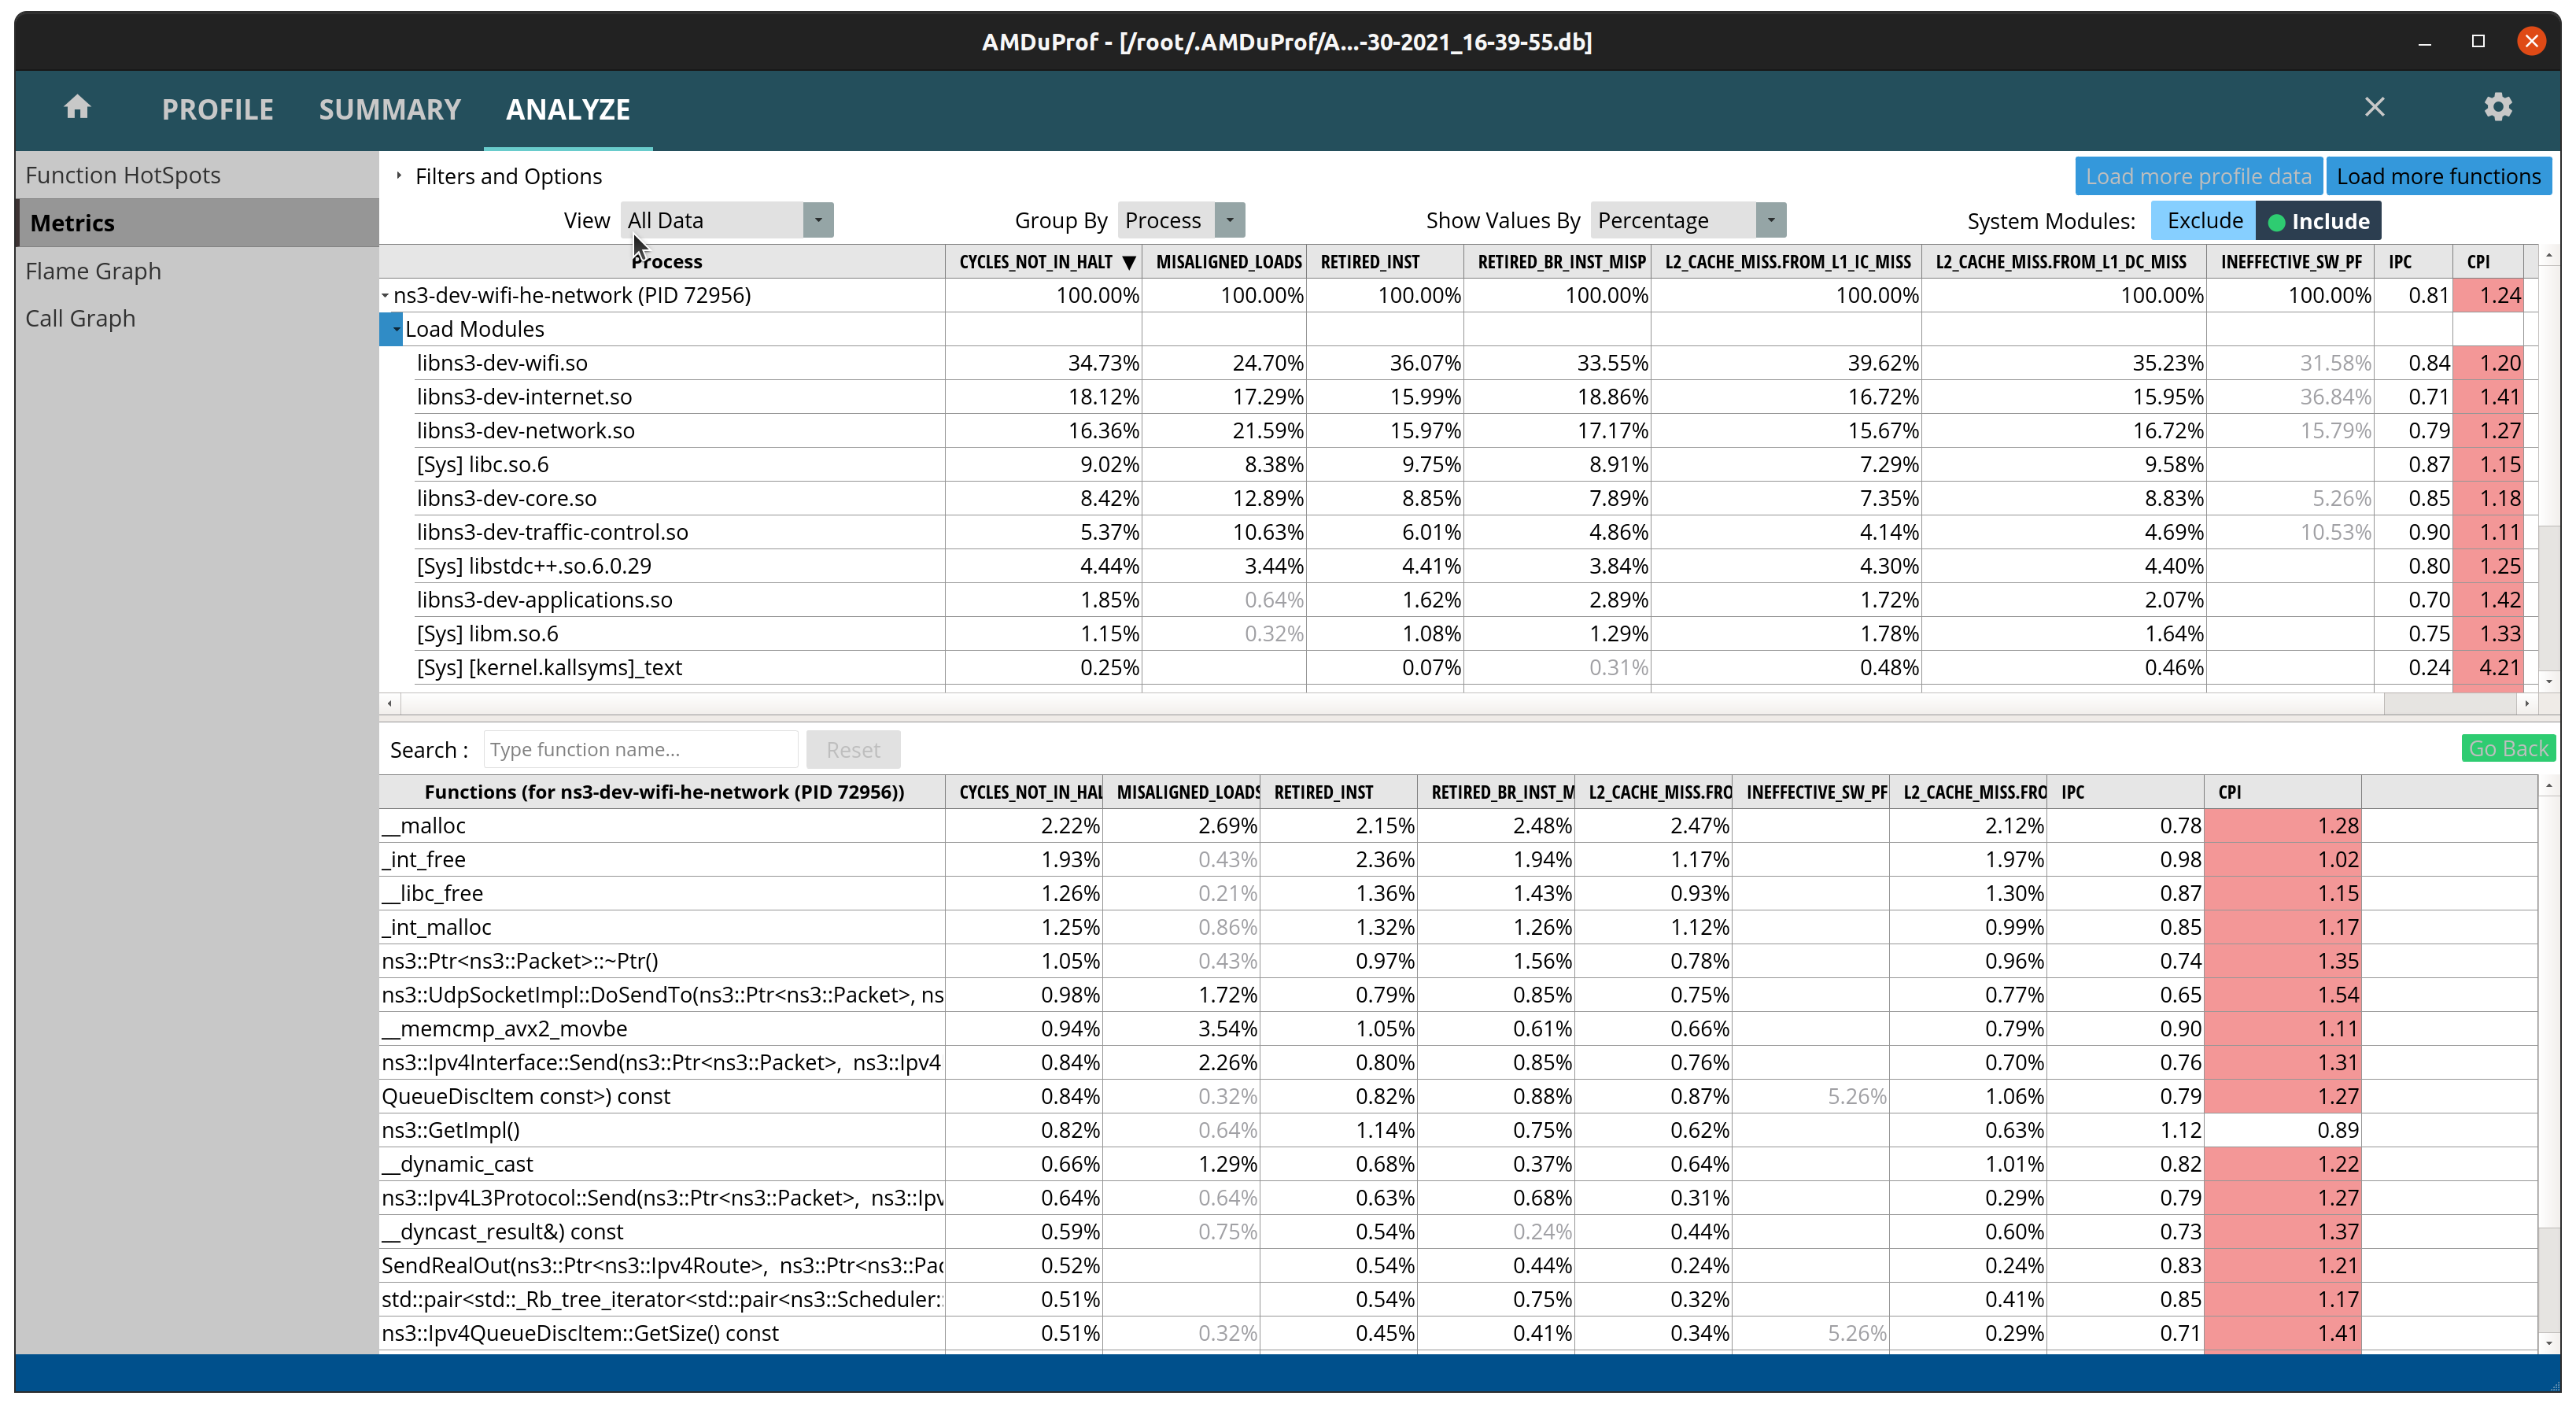
Here are a few cases where AMD uProf was used to identify performance bottlenecks:
WifiMacQueue::TtlExceededdereferenced data out of cache when calling Simulator::Now(). The adopted solution was to move Simulator::Now() out of TtlExceeded and reuse the value and inlining TtlExceeded. This resulted in a ~1.20x speedup with the test suite (./test.py -d). More details on: issue 280 and merge request MR681.wifi-primary-channelstest suite was extremely slow due to unnecessary RF processing. The adopted solution was to replace the filtering step of the entire channel to just the desired sub-band, and assuming sub-bands are uniformly sized, saving multiplications in the integral used to compute the power of each sub-band. This resulted in a 6x speedup with./ns3 run "test-runner --fullness=TAKES_FOREVER --test-name=wifi-primary-channels". More details on: issue 426 and merge request MR677.Continuing the work on
wifi-primary-channelstest suite, profiling showed an excessive number of cache misses inInterferenceHelper::GetNextPosition. This function searches for an iterator on a map, which is very fast if the map is small and fits in the cache, which was not the case. After reviewing the code, it was noticed in most cases this call was unnecessary as the iterator was already known. The adopted solution was to reuse the iterator whenever possible. This resulted in a 1.78x speedup on top of the previous 6x with./ns3 run "test-runner --fullness=TAKES_FOREVER --test-name=wifi-primary-channels". More details on: issue 426 and merge requests MR677 and MR680.Position-Independent Code libraries (
-fPIC) have an additional layer of indirection that increases instruction cache misses. The adopted solution was to disable semantic interposition with flag-fno-semantic-interpositionon GCC. This is the default setting on Clang. This results in approximately 1.14x speedup with./test.py -d. More details on: MR777.
Note: all speedups above were measured on the same machine. Results may differ based on clock speeds, cache sizes, number of cores, memory bandwidth and latency, storage throughput and latency.
Intel VTune
Intel VTune works much like Linux Perf and Hotspot GUI, but is available in more platforms (Linux, Windows and Mac) using Intel processors. Differently from Perf, it provides more performance trackers for finer analysis.
When you open the program, you will be greeted by the landing page
shown in the following image. To start a new profiling project, click
in the Configure Analysis button. If you already have a project,
right-click the entry and click to configure analysis to reuse the
settings.

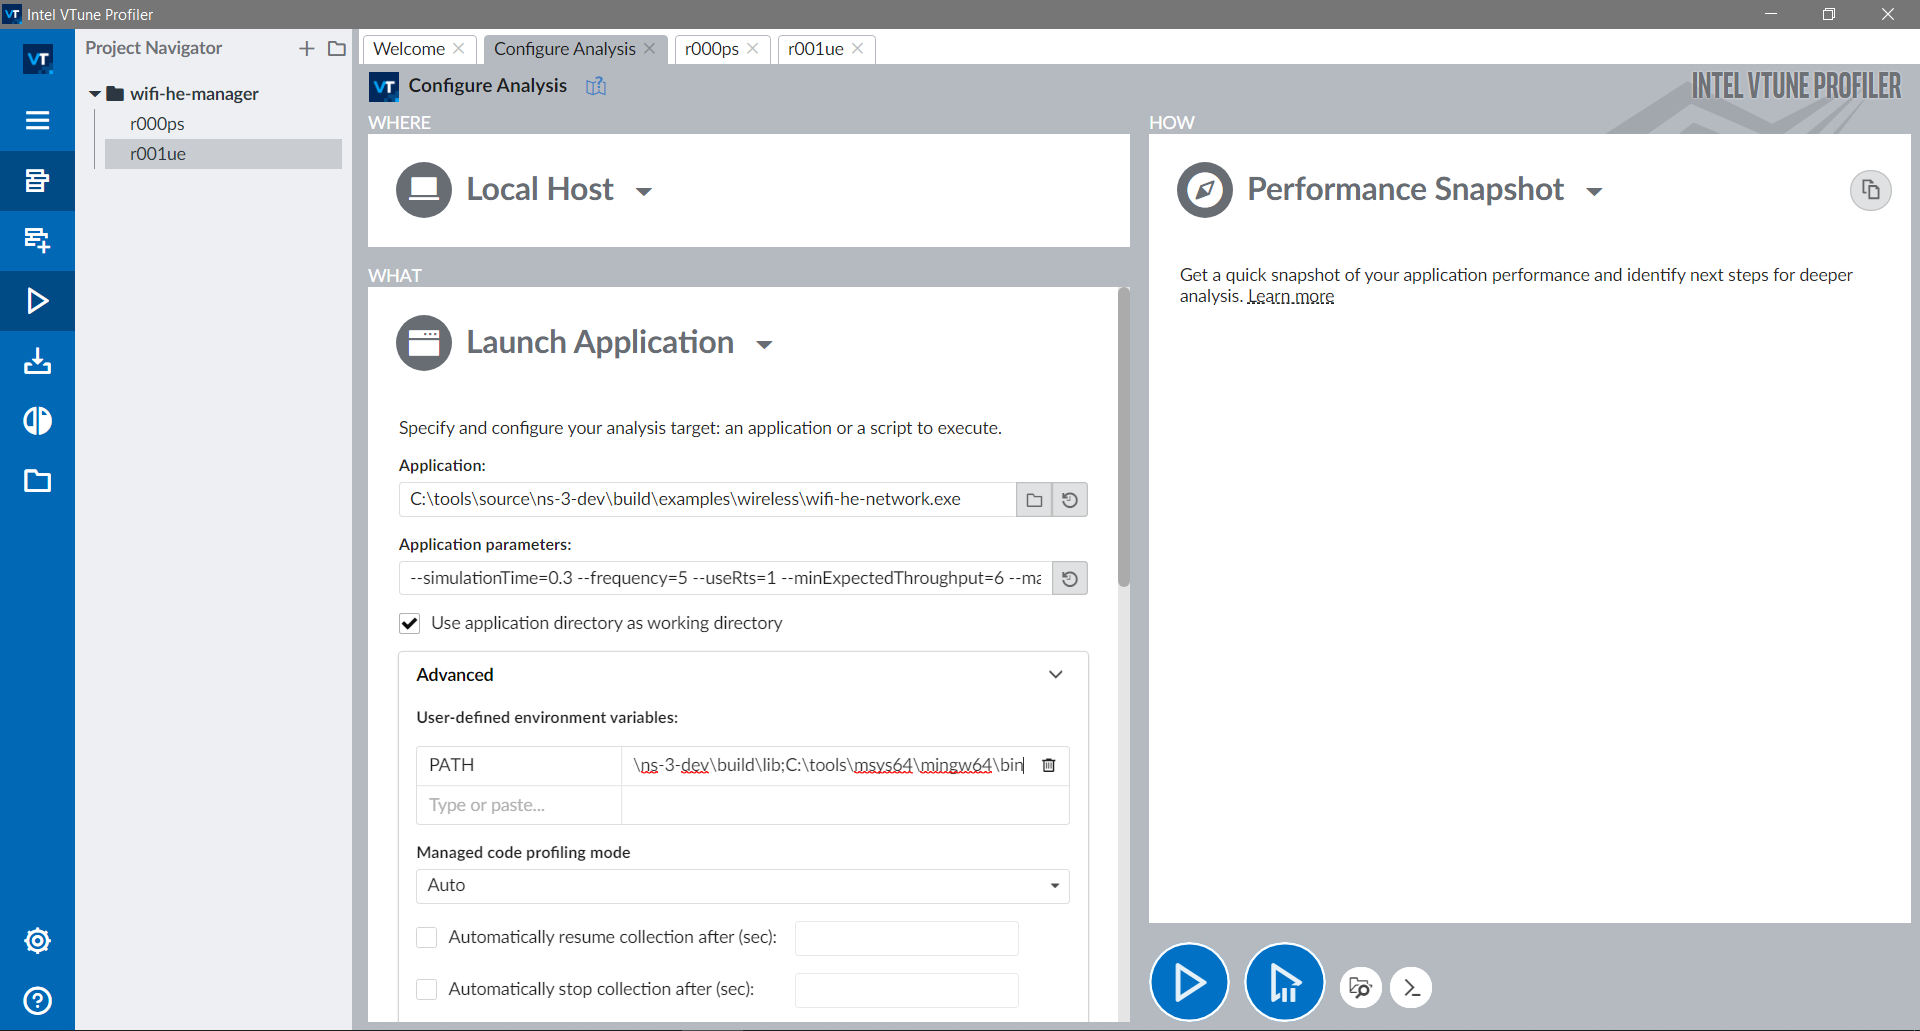
A configuration page will open, where you can fill the fields with the path to the program, arguments, and set working directory and environment variables.
Note: in this example on Windows using MinGW,
we need to define the PATH environment variable with the paths
to both ~/ns-3-dev/build/lib and the MinGW binaries folder
(~/msys64/mingw64/bin), which contains essential libraries.
On Linux-like systems you will need to define the
LD_LIBRARY_PATH environment variable instead of PATH.
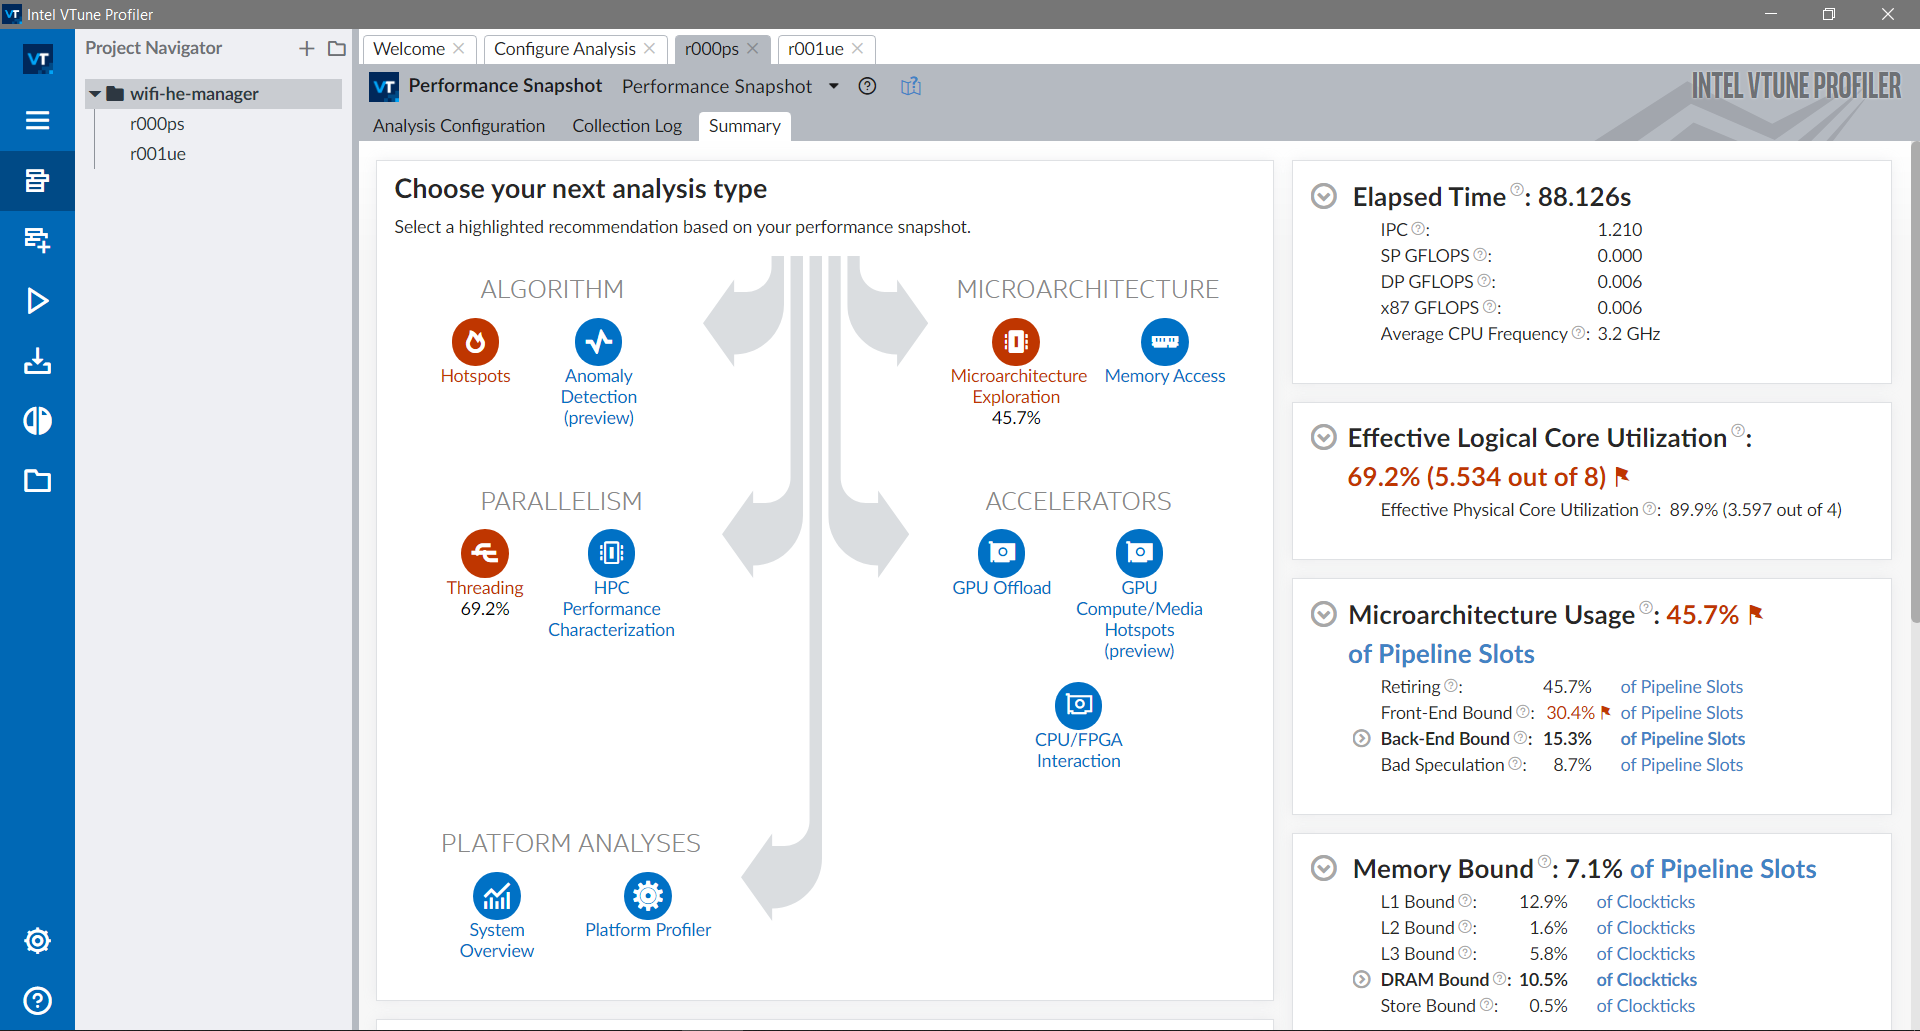
Clicking on the Performance Snapshot shows the different profiling
options.
If executed as is, a quicker profiling will be executed to determine what areas should be profiled with more details. For the specific example, it is indicated that there are microarchitectural bottlenecks and low parallelism (not a surprise since ns-3 is single-threaded).
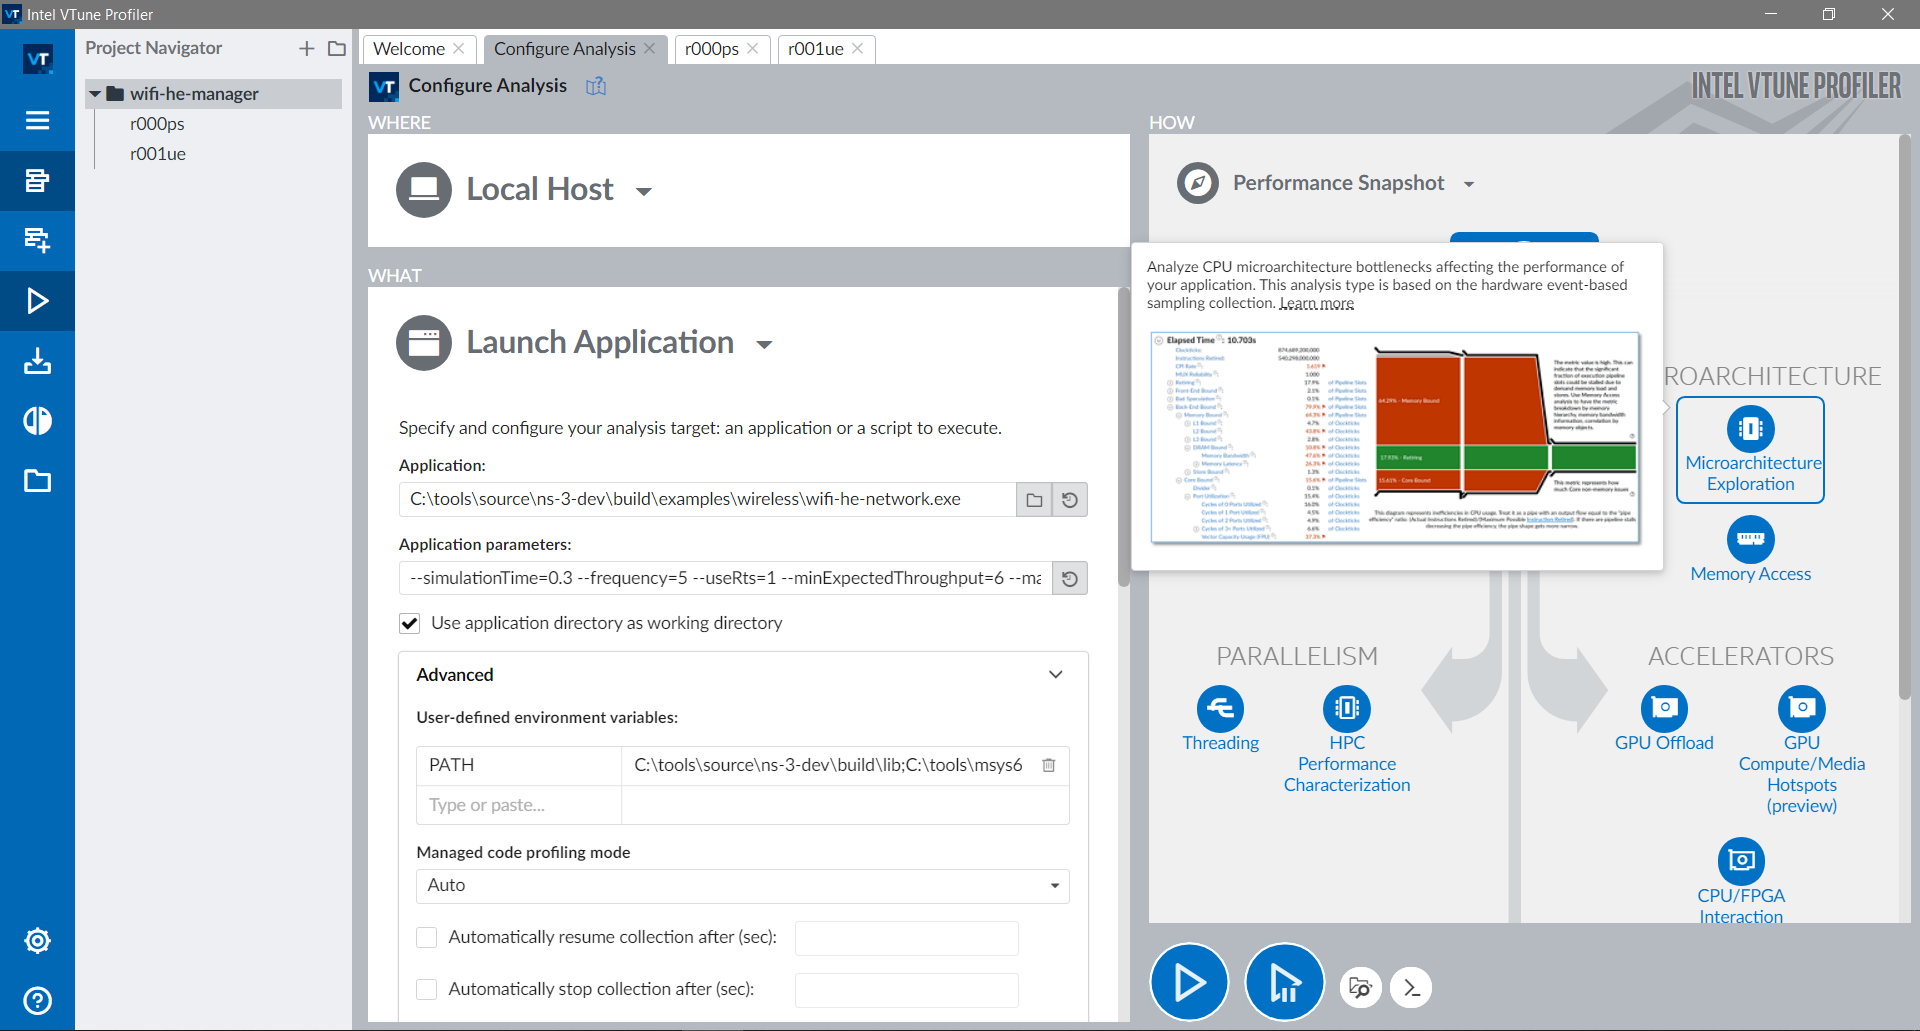
If the microarchitecture exploration option is selected, cycles,
branch mispredictions, cache misses and other metrics will be collected.
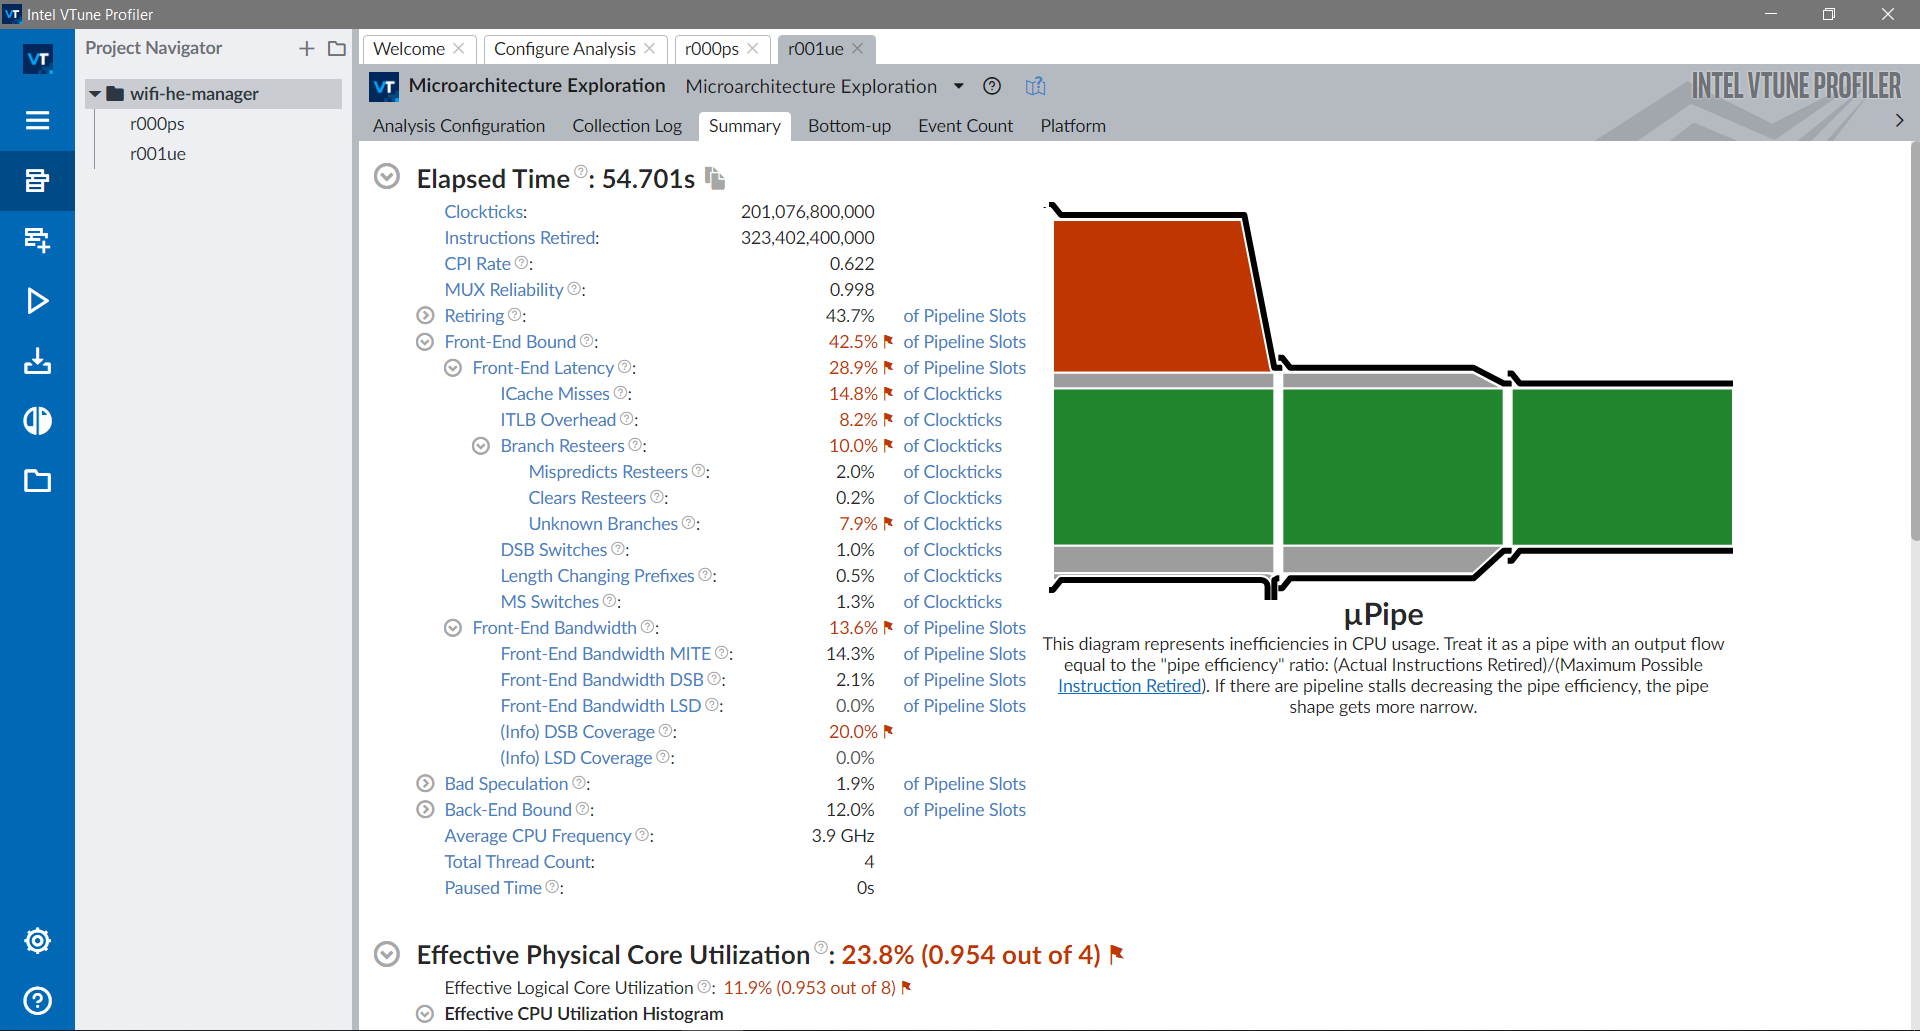
After executing the microarchitecture exploration, a summary will
be shown. Hovering the mouse over the red flags will explain what
each sentence means and how it impacts performance.
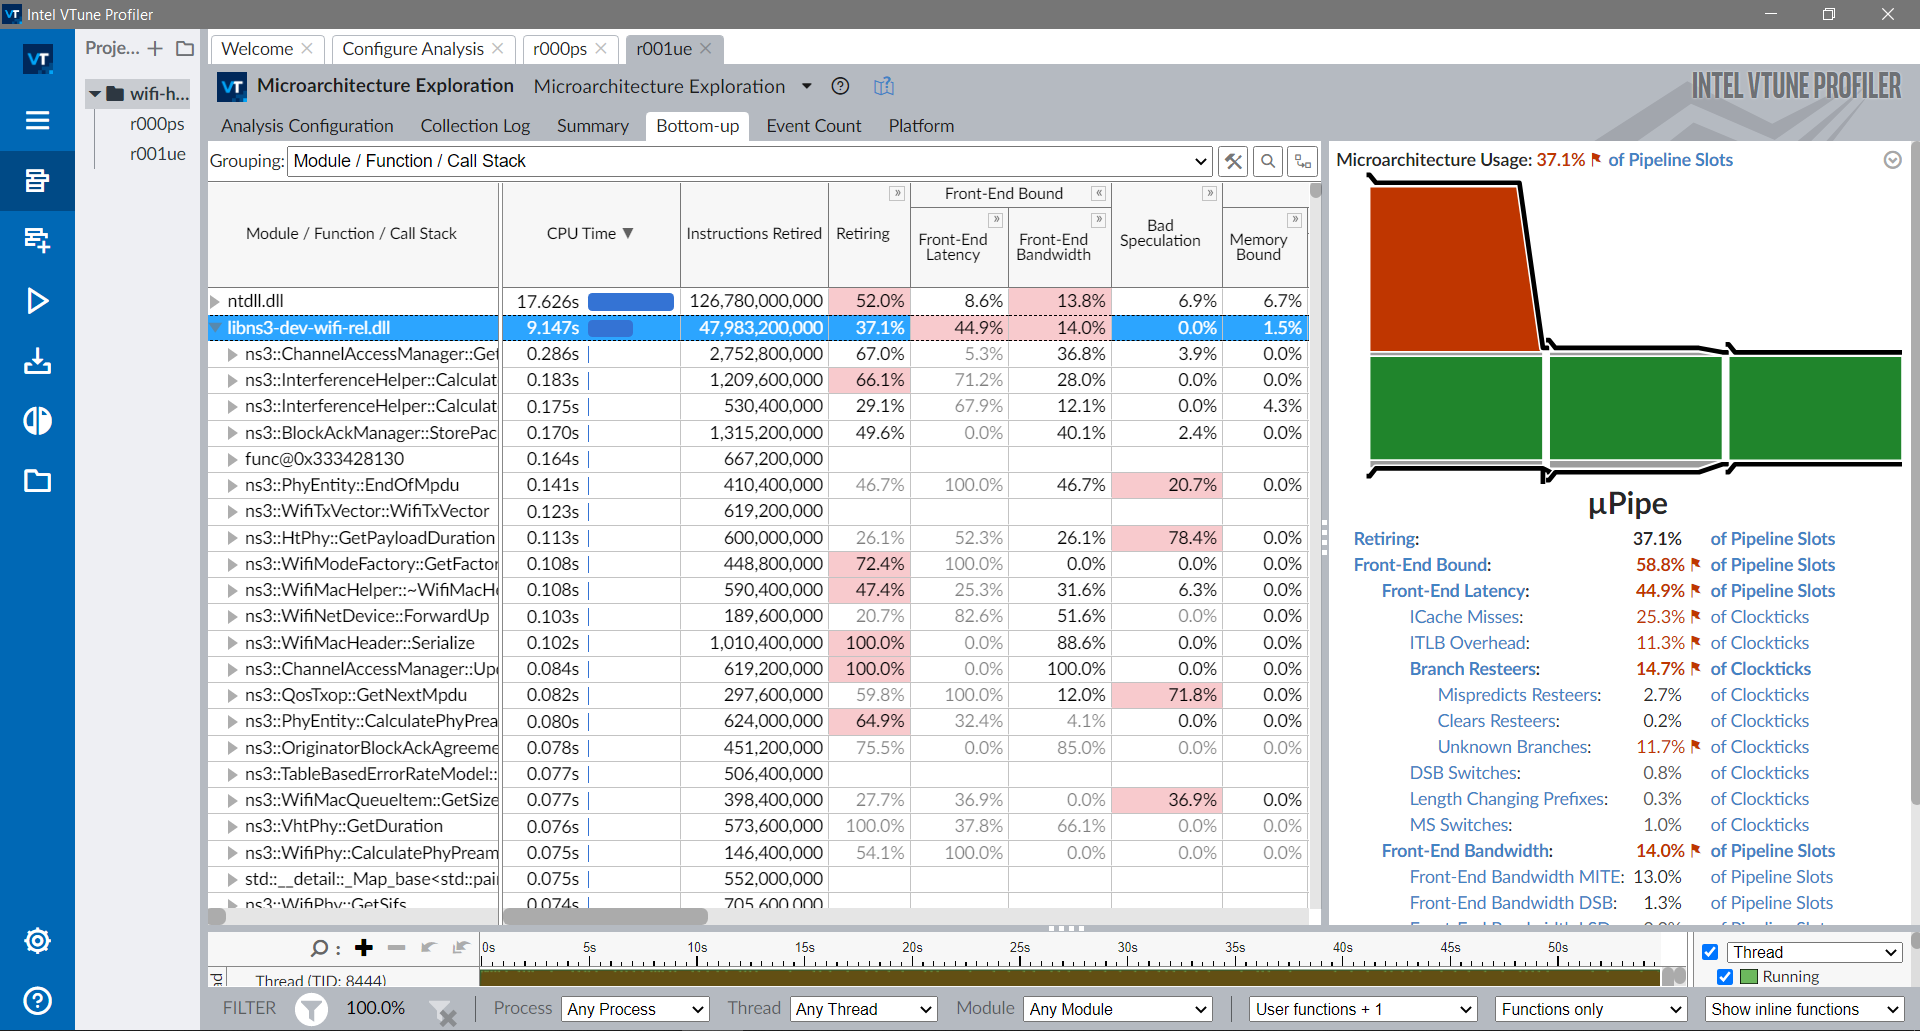
Clicking in the Bottom-up tab shows all the information per module.
A plethora of stats such as CPU time, instructions retired,
retiring percentage (how many of the dispatched instructions
were executed until the end, usually lower than 100% because of branch
mispredictions), bad speculation, cache misses, unused load ports,
and more.
The stats for the wifi module are shown below. The retiring metric indicates about 40% of dispatched instructions are executed. The diagram on the right shows the bottleneck is in the front-end of the pipeline (red), due to high instruction cache misses, translation lookaside buffer (TLB) overhead and unknown branches (most likely callbacks).
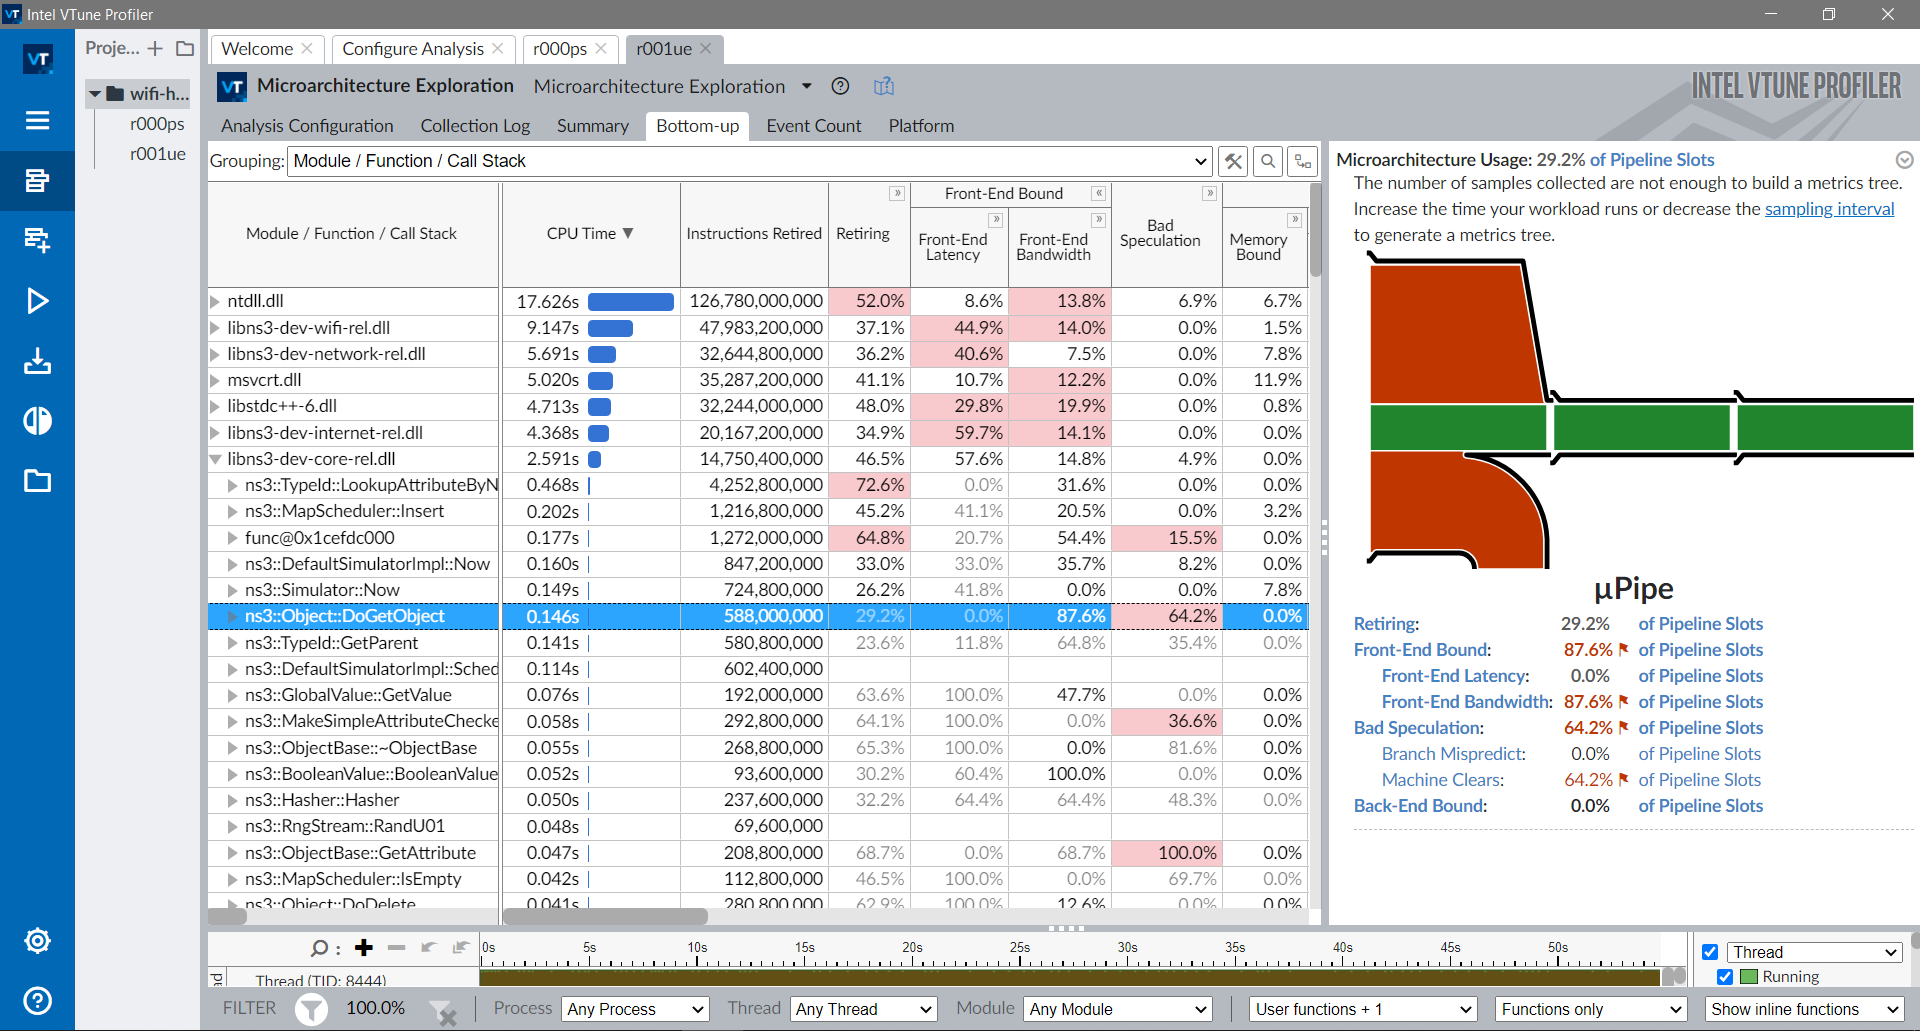
The stats for the core module are shown below. More specifically for the ns3::Object::DoGetObject function. Metrics indicates about 63% of bad speculations. The diagram on the right shows that there are bottlenecks both in the front-end and due to bad speculation (red).
System calls profilers
System call profilers collect information on which system calls were made by a program, how long they took to be fulfilled and how many of them resulted in errors.
There are many system call profilers, including dtrace, strace and procmon.
An overview on how to use strace is provided in the following section.
Strace
The strace is a system calls (syscalls) profiler for Linux. It can filter specific syscalls, or gather stats during the execution.
To collect statistics, use strace -c:
~ns-3-dev/$ ./ns3 run "wifi-he-network --simulationTime=0.3 --frequency=5 --useRts=1 --minExpectedThroughput=6 --maxExpectedThroughput=745" --command-template "strace -c %s" --no-build
MCS value               Channel width           GI                      Throughput
0                       20 MHz                  3200 ns                 5.91733 Mbit/s
...
11                      160 MHz                 800 ns                  524.459 Mbit/s
% time     seconds  usecs/call     calls    errors syscall
------ ----------- ----------- --------- --------- ----------------
 37.62    0.004332          13       326       233 openat
 35.46    0.004083           9       415           mmap
...
------ ----------- ----------- --------- --------- ----------------
100.00    0.011515           8      1378       251 total
In the example above, the syscalls are listed in the right, after the time spent on each syscall, number of calls and errors.
The errors can be caused due to multiple reasons and may not
be a problem. To check if they were problems, strace can log the
syscalls with strace -o calls.log:
~ns-3-dev/$ ./ns3 run "wifi-he-network --simulationTime=0.3 --frequency=5 --useRts=1 --minExpectedThroughput=6 --maxExpectedThroughput=745" --command-template "strace -o calls.log %s" --no-build
MCS value               Channel width           GI                      Throughput
0                       20 MHz                  3200 ns                 5.91733 Mbit/s
...
11                      160 MHz                 800 ns                  524.459 Mbit/s
Looking at the calls.log file, we can see different sections. In the
following section, the example is executed (execve), architecture is checked (arch_prctl),
memory is mapped for execution (mmap) and LD_PRELOAD use is checked.
execve("~/ns-3-dev/build/examples/wireless/ns3-dev-wifi-he-network", ["~/ns-3-dev/b"..., "--simulationTime=0.3", "--frequency=5", "--useRts=1", "--minExpectedThroughput=6", "--maxExpectedThroughput=745"], 0x7fffb0f91ad8 /* 3 vars */) = 0
brk(NULL)                               = 0x563141b37000
arch_prctl(0x3001 /* ARCH_??? */, 0x7ffff8d63a50) = -1 EINVAL (Invalid argument)
mmap(NULL, 8192, PROT_READ|PROT_WRITE, MAP_PRIVATE|MAP_ANONYMOUS, -1, 0) = 0x7f103c2e9000
access("/etc/ld.so.preload", R_OK)      = -1 ENOENT (No such file or directory)
Then the program searches for the wifi module library and fails multiple times (the errors seen in the table above).
openat(AT_FDCWD, "~/ns-3-dev/build/lib/glibc-hwcaps/x86-64-v3/libns3-dev-wifi.so", O_RDONLY|O_CLOEXEC) = -1 ENOENT (No such file or directory)
newfstatat(AT_FDCWD, "~/ns-3-dev/build/lib/glibc-hwcaps/x86-64-v3", 0x7ffff8d62c80, 0) = -1 ENOENT (No such file or directory)
...
openat(AT_FDCWD, "~/ns-3-dev/build/lib/x86_64/libns3-dev-wifi.so", O_RDONLY|O_CLOEXEC) = -1 ENOENT (No such file or directory)
newfstatat(AT_FDCWD, "~/ns-3-dev/build/lib/x86_64", 0x7ffff8d62c80, 0) = -1 ENOENT (No such file or directory)
The library is finally found and its header is read:
openat(AT_FDCWD, "~/ns-3-dev/build/lib/libns3-dev-wifi.so", O_RDONLY|O_CLOEXEC) = 3
read(3, "\177ELF\2\1\1\3\0\0\0\0\0\0\0\0\3\0>\0\1\0\0\0py\30\0\0\0\0\0"..., 832) = 832
Then other modules that wifi depends on are loaded, then execution of the program continues to the main function of the simulation.
Strace was used to track down issues found while running the lena-radio-link-failure example.
Its strace -c table was the following:
% time     seconds  usecs/call     calls    errors syscall
------ ----------- ----------- --------- --------- ----------------
 31,51    0,246243           2    103480       942 openat
 30,23    0,236284           2    102360           write
 19,90    0,155493           1    102538           close
 16,65    0,130132           1    102426           lseek
  1,05    0,008186          18       437           mmap
  0,21    0,001671          16        99           newfstatat
  0,20    0,001595          11       134           mprotect
  0,18    0,001391          14        98           read
...
------ ----------- ----------- --------- --------- ----------------
100,00    0,781554           1    411681       951 total
Notice the number of openat, write, close and lseek calls
are much more frequent than the other calls. These mean
lena-radio-link-failure is opening, then seeking, then writing,
then closing at least one file handler.
Using strace, we can easily find the most frequently used file handlers.
~ns-3-dev/$./ns3 run "lena-radio-link-failure --numberOfEnbs=2 --useIdealRrc=0 --interSiteDistance=700 --simTime=17" --command-template="strace %s"
...
openat(AT_FDCWD, "DlTxPhyStats.txt", O_WRONLY|O_CREAT|O_APPEND, 0666) = 3
lseek(3, 0, SEEK_END)                   = 9252
write(3, "635\t1\t1\t1\t0\t20\t1191\t0\t1\t0\n", 26) = 26
close(3)                                = 0
openat(AT_FDCWD, "DlMacStats.txt", O_WRONLY|O_CREAT|O_APPEND, 0666) = 3
lseek(3, 0, SEEK_END)                   = 11100
write(3, "0.635\t1\t1\t64\t6\t1\t20\t1191\t0\t0\t0\n", 31) = 31
close(3)                                = 0
openat(AT_FDCWD, "UlMacStats.txt", O_WRONLY|O_CREAT|O_APPEND, 0666) = 3
lseek(3, 0, SEEK_END)                   = 8375
write(3, "0.635\t1\t1\t64\t6\t1\t0\t85\t0\n", 24) = 24
close(3)                                = 0
openat(AT_FDCWD, "DlRsrpSinrStats.txt", O_WRONLY|O_CREAT|O_APPEND, 0666) = 3
lseek(3, 0, SEEK_END)                   = 16058
write(3, "0.635214\t1\t1\t1\t6.88272e-15\t22.99"..., 37) = 37
close(3)                                = 0
openat(AT_FDCWD, "UlTxPhyStats.txt", O_WRONLY|O_CREAT|O_APPEND, 0666) = 3
...
With the name of the files, we can look at the code that manipulates them.
The issue above was found in MR777, were performance for some LTE examples
regressed for no apparent reason. The flame graph below, produced by AMD uProf,
contains four large columns/”flames” in red, which
correspond to the write, openat, close and lseek syscalls.

Upon closer inspection, these syscalls take a long time to complete due to the underlying filesystem of the machine running the example (NTFS mount using the ntfs-3g FUSE filesystem). In other words, the bottleneck only exists when running the example in slow file systems (e.g. FUSE and network file systems).
The merge request MR814 addressed the issue by keeping the files open throughout the simulation. That alone resulted in a 1.75x speedup.
Compilation Profilers
Compilation profilers can help identifying which steps of the compilation are slowing it down. These profilers are built into the compilers themselves, only requiring third-party tools to consolidate the results.
The GCC feature is mentioned and exemplified, but is not the recommended compilation profiling method. For that, Clang is recommended.
GCC
GCC has a special flag -ftime-report, which makes it print a table
with time spent per compilation phase for each compiled file. The printed
output for a file is shown below. The line of --- was inserted for clarity.
Time variable                                  usr           sys          wall               GGC
phase setup                        :   0.00 (  0%)   0.00 (  0%)   0.01 (  1%)    1478 kB (  2%)
phase parsing                      :   0.31 ( 46%)   0.17 ( 85%)   0.48 ( 55%)   55432 kB ( 71%)
phase lang. deferred               :   0.03 (  4%)   0.00 (  0%)   0.03 (  3%)    4287 kB (  5%)
phase opt and generate             :   0.32 ( 48%)   0.03 ( 15%)   0.35 ( 40%)   16635 kB ( 21%)
phase last asm                     :   0.01 (  1%)   0.00 (  0%)   0.01 (  1%)     769 kB (  1%)
------------------------------------------------------------------------------------------------
|name lookup                       :   0.05 (  7%)   0.02 ( 10%)   0.04 (  5%)    2468 kB (  3%)
|overload resolution               :   0.05 (  7%)   0.00 (  0%)   0.05 (  6%)    4217 kB (  5%)
dump files                         :   0.00 (  0%)   0.00 (  0%)   0.01 (  1%)       0 kB (  0%)
callgraph construction             :   0.01 (  1%)   0.00 (  0%)   0.01 (  1%)    2170 kB (  3%)
...
preprocessing                      :   0.05 (  7%)   0.06 ( 30%)   0.10 ( 11%)    1751 kB (  2%)
parser (global)                    :   0.06 (  9%)   0.03 ( 15%)   0.07 (  8%)   16303 kB ( 21%)
parser struct body                 :   0.06 (  9%)   0.04 ( 20%)   0.08 (  9%)   12525 kB ( 16%)
parser enumerator list             :   0.01 (  1%)   0.00 (  0%)   0.00 (  0%)     112 kB (  0%)
parser function body               :   0.02 (  3%)   0.02 ( 10%)   0.02 (  2%)    3039 kB (  4%)
parser inl. func. body             :   0.03 (  4%)   0.00 (  0%)   0.01 (  1%)    2024 kB (  3%)
parser inl. meth. body             :   0.02 (  3%)   0.01 (  5%)   0.06 (  7%)    5792 kB (  7%)
template instantiation             :   0.09 ( 13%)   0.01 (  5%)   0.13 ( 15%)   12274 kB ( 16%)
...
symout                             :   0.01 (  1%)   0.00 (  0%)   0.02 (  2%)    8114 kB ( 10%)
...
TOTAL                              :   0.67          0.20          0.88          78612 kB
In the table above, the first few lines show the five main compilations steps: setup,
parsing, lang. deferred (C++ specific transformations),
opt(imize) and generate (code), last asm (produce binary code).
The lines below the --- line show sub-steps of the five main compilation steps.
For this specific case, parsing global definitions (21%) and structures (16%),
template instantiation (16%) and generating the code in symout (10%).
Aggregating the data into a meaningful output to help focus where to improve is not that easy and it is not a priority for GCC developers.
It is recommended to use the Clang alternative.
Clang
Clang can output very similar results with the -ftime-trace flag, but can also aggregate
it in a more meaningful way. With the help of the third-party tool ClangBuildAnalyzer,
we can have really good insights on where to spend time trying to speed up the compilation.
Support for building with -ftime-trace, compiling ClangBuildAnalyzer and producing a
report for the project have been baked into the CMake project of ns-3, and can be enabled
with -DNS3_CLANG_TIMETRACE=ON.
~/ns-3-dev/cmake_cache$ cmake -DNS3_CLANG_TIMETRACE=ON ..
Or via ns3:
~/ns-3-dev$ ./ns3 configure -- -DNS3_CLANG_TIMETRACE=ON
The entire procedure looks like the following:
~/ns-3-dev$ CXX="clang++" ./ns3 configure -d release --enable-examples --enable-tests -- -DNS3_CLANG_TIMETRACE=ON
~/ns-3-dev$ ./ns3 build timeTraceReport
~/ns-3-dev$ cat ClangBuildAnalyzerReport.txt
Analyzing build trace from '~/ns-3-dev/cmake_cache/clangBuildAnalyzerReport.bin'...
**** Time summary:
Compilation (2993 times):
  Parsing (frontend):         2476.1 s
  Codegen & opts (backend):   1882.9 s

**** Files that took longest to parse (compiler frontend):
  8966 ms: src/test/CMakeFiles/libtest.dir/traced/traced-callback-typedef-test-suite.cc.o
  6633 ms: src/wifi/examples/CMakeFiles/wifi-bianchi.dir/wifi-bianchi.cc.o
...

**** Files that took longest to codegen (compiler backend):
36430 ms: src/wifi/CMakeFiles/libwifi-test.dir/test/block-ack-test-suite.cc.o
24941 ms: src/wifi/CMakeFiles/libwifi-test.dir/test/wifi-mac-ofdma-test.cc.o
...

**** Templates that took longest to instantiate:
12651 ms: std::unordered_map<int, int> (615 times, avg 20 ms)
10950 ms: std::_Hashtable<int, std::pair<const int, int>, std::allocator<std::... (615 times, avg 17 ms)
10712 ms: std::__detail::__hyperg<long double> (1172 times, avg 9 ms)
...

**** Template sets that took longest to instantiate:
111660 ms: std::list<$> (27141 times, avg 4 ms)
 79892 ms: std::_List_base<$> (27140 times, avg 2 ms)
 75131 ms: std::map<$> (11752 times, avg 6 ms)
 65214 ms: std::allocator<$> (66622 times, avg 0 ms)
...

**** Functions that took longest to compile:
  7206 ms: OfdmaAckSequenceTest::CheckResults(ns3::Time, ns3::Time, unsigned ch... (~/ns-3-dev/src/wifi/test/wifi-mac-ofdma-test.cc)
  6146 ms: PieQueueDiscTestCase::RunPieTest(ns3::QueueSizeUnit) (~/ns-3-dev/src/traffic-control/test/pie-queue-disc-test-suite.cc)
...

**** Function sets that took longest to compile / optimize:
14801 ms: std::__cxx11::basic_string<$> ns3::CallbackImplBase::GetCppTypeid<$>() (2342 times, avg 6 ms)
12013 ms: ns3::CallbackImpl<$>::DoGetTypeid[abi:cxx11]() (1283 times, avg 9 ms)
10034 ms: ns3::Ptr<$>::~Ptr() (5975 times, avg 1 ms)
 8932 ms: ns3::Callback<$>::DoAssign(ns3::Ptr<$>) (591 times, avg 15 ms)
 6318 ms: ns3::CallbackImpl<$>::DoGetTypeid() (431 times, avg 14 ms)
...

*** Expensive headers:
293609 ms: ~/ns-3-dev/build/include/ns3/log.h (included 1404 times, avg 209 ms), included via:
  cqa-ff-mac-scheduler.cc.o  (758 ms)
  ipv6-list-routing.cc.o  (746 ms)
  ...

239884 ms: ~/ns-3-dev/build/include/ns3/nstime.h (included 1093 times, avg 219 ms), included via:
  lte-enb-rrc.cc.o lte-enb-rrc.h  (891 ms)
  wifi-acknowledgment.cc.o wifi-acknowledgment.h  (877 ms)
  ...

216218 ms: ~/ns-3-dev/build/include/ns3/object.h (included 1205 times, avg 179 ms), included via:
  energy-source-container.cc.o energy-source-container.h energy-source.h  (1192 ms)
  phased-array-model.cc.o phased-array-model.h  (1135 ms)
  ...

206801 ms: ~/ns-3-dev/build/include/ns3/core-module.h (included 195 times, avg 1060 ms), included via:
  sample-show-progress.cc.o  (1973 ms)
  length-example.cc.o  (1848 ms)
  ...

193116 ms: /usr/bin/../lib/gcc/x86_64-linux-gnu/11/../../../../include/c++/11/bits/basic_string.h (included 1499 times, avg 128 ms), included via:
  model-typeid-creator.h attribute-default-iterator.h type-id.h attribute.h string  (250 ms)
  li-ion-energy-source-helper.h energy-model-helper.h attribute.h string  (243 ms)
  ...

185075 ms: /usr/bin/../lib/gcc/x86_64-linux-gnu/11/../../../../include/c++/11/bits/ios_base.h (included 1495 times, avg 123 ms), included via:
  iomanip  (403 ms)
  mpi-test-fixtures.h iomanip  (364 ms)
  ...

169464 ms: ~/ns-3-dev/build/include/ns3/ptr.h (included 1399 times, avg 121 ms), included via:
  lte-test-rlc-um-e2e.cc.o config.h  (568 ms)
  lte-test-rlc-um-transmitter.cc.o simulator.h event-id.h  (560 ms)
  ...


  done in 2.8s.
The output printed out contain a summary of time spent on parsing and on code generation, along
with multiple lists for different tracked categories. From the summary, it is clear that parsing times
are very high when compared to the optimization time (-O3). Skipping the others categories and going straight
to the expensive headers section, we can better understand why parsing times are so high, with some headers
adding as much as 5 minutes of CPU time to the parsing time.
Precompiled headers (-DNS3_PRECOMPILE_HEADERS=ON) can drastically speed up parsing times,
however, they can increase ccache misses, reducing the time of the first
compilation at the cost of increasing recompilation times.
CMake Profiler
CMake has a built-in tracer that permits tracking hotspots in the CMake files slowing down the project configuration. To use the tracer, call cmake directly from a clean CMake cache directory:
~/ns-3-dev/cmake-cache$ cmake .. --profiling-format=google-trace --profiling-output=../cmake_performance_trace.log
Or using the ns3 wrapper:
~/ns-3-dev$ ./ns3 configure --trace-performance
A cmake_performance_trace.log file will be generated in the ns-3-dev directory.
The tracing results can be visualized using the about:tracing panel available
in Chromium-based browsers or a compatible trace viewer such as Perfetto UI.
After opening the trace file, select the traced process and click on any of the blocks to inspect the different stacks and find hotspots. An auxiliary panel containing the function/macro name, arguments and location can be shown, providing enough information to trace back the location of each specific call.
Just like in performance profilers, visual inspection makes it easier to identify hotspots and focus on trying to optimize what matters most.
The trace below was generated during the discussion of issue #588, while investigating the long configuration times, especially when using HDDs.
The single largest contributor was CMake’s configure_file, used to keeping
up-to-date copies of headers in the output directory.
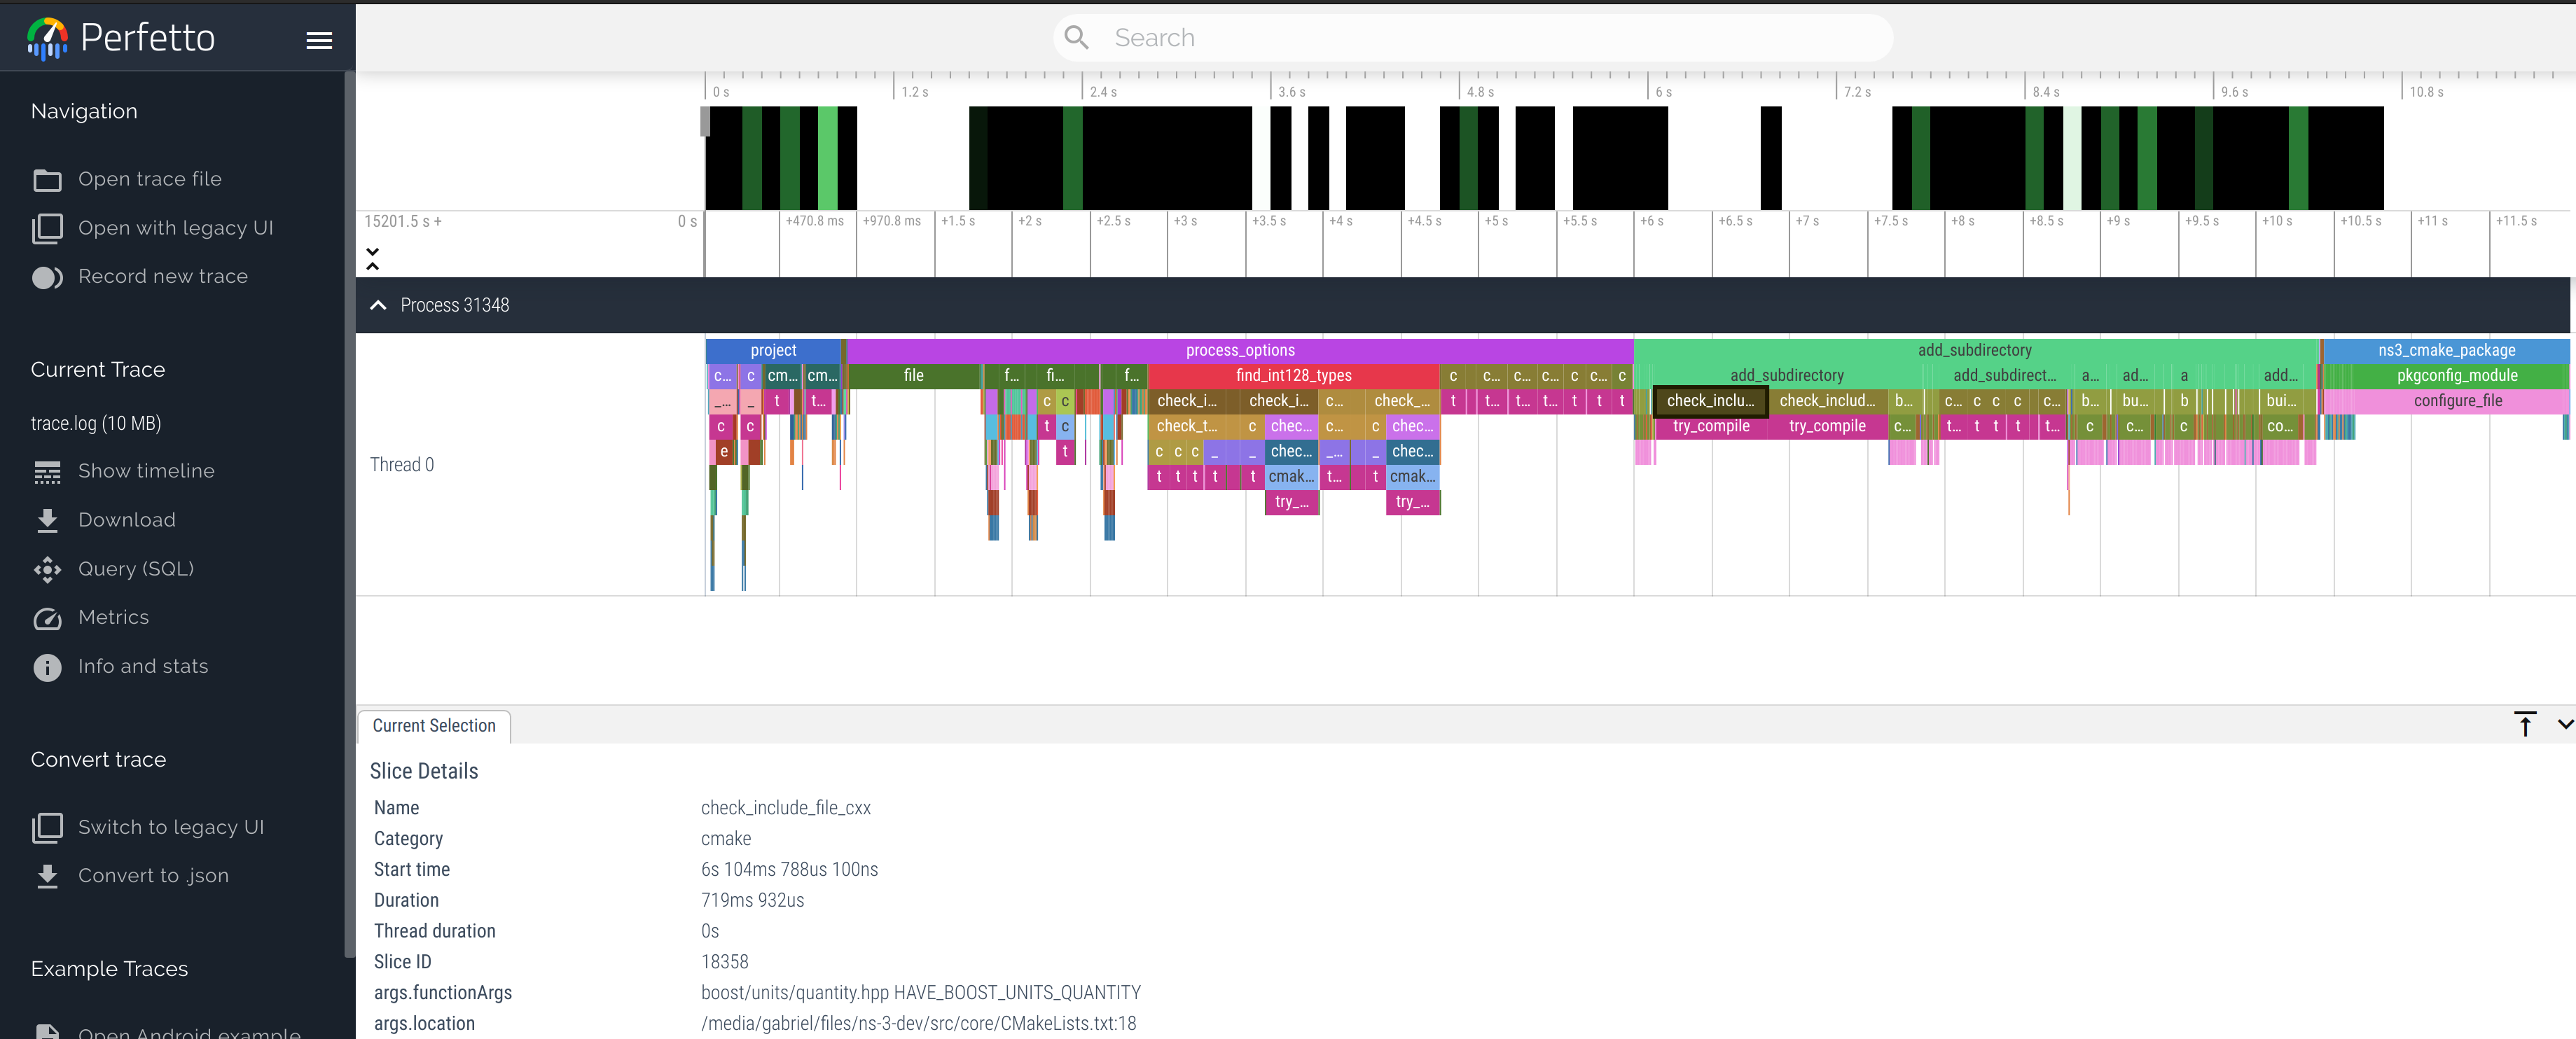
In MR911, alternatives such as stub headers that include the original header files, keeping them in their respective modules, and symlinking headers to the output directory were used to reduce the configuration overhead.
Note: when testing I/O bottlenecks, you may want to drop filesystem caches, otherwise the cache may hide the issues. In Linux, the caches can be cleared using the following command:
~/ns-3-dev$ sudo sysctl vm.drop_caches=3
