Making Plots using the Gnuplot Class
There are 2 common methods to make a plot using ns-3 and gnuplot (http://www.gnuplot.info):
Create a gnuplot control file using ns-3’s Gnuplot class.
Create a gnuplot data file using values generated by ns-3.
This section is about method 1, i.e. it is about how to make a plot using ns-3’s Gnuplot class. If you are interested in method 2, see the “A Real Example” subsection under the “Tracing” section in the ns-3 Tutorial.
Creating Plots Using the Gnuplot Class
The following steps must be taken in order to create a plot using ns-3’s Gnuplot class:
Modify your code so that is uses the Gnuplot class and its functions.
Run your code so that it creates a gnuplot control file.
Call gnuplot with the name of the gnuplot control file.
View the graphics file that was produced in your favorite graphics viewer.
See the code from the example plots that are discussed below for details on step 1.
An Example Program that Uses the Gnuplot Class
An example program that uses ns-3’s Gnuplot class can be found here:
src/stats/examples/gnuplot-example.cc
In order to run this example, do the following:
$ ./ns3 run src/stats/examples/gnuplot-example
This should produce the following gnuplot control files:
plot-2d.plt
plot-2d-with-error-bars.plt
plot-3d.plt
In order to process these gnuplot control files, do the following:
$ gnuplot plot-2d.plt
$ gnuplot plot-2d-with-error-bars.plt
$ gnuplot plot-3d.plt
This should produce the following graphics files:
plot-2d.png
plot-2d-with-error-bars.png
plot-3d.png
You can view these graphics files in your favorite graphics viewer. If you have gimp installed on your machine, for example, you can do this:
$ gimp plot-2d.png
$ gimp plot-2d-with-error-bars.png
$ gimp plot-3d.png
An Example 2-Dimensional Plot
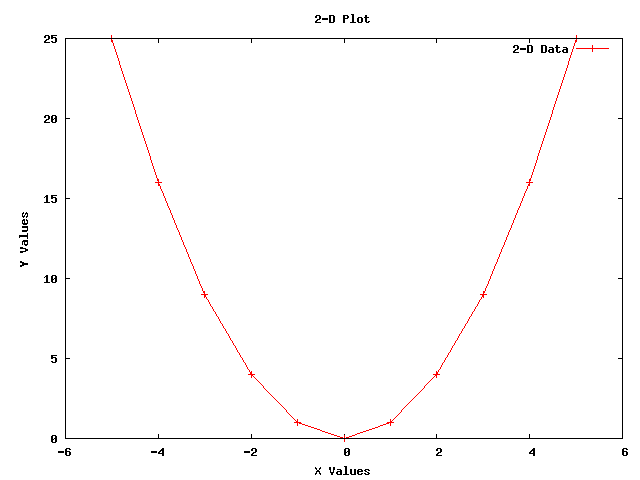
The following 2-Dimensional plot

was created using the following code from gnuplot-example.cc:
std::string fileNameWithNoExtension = "plot-2d";
std::string graphicsFileName        = fileNameWithNoExtension + ".png";
std::string plotFileName            = fileNameWithNoExtension + ".plt";
std::string plotTitle               = "2-D Plot";
std::string dataTitle               = "2-D Data";

// Instantiate the plot and set its title.
Gnuplot plot (graphicsFileName);
plot.SetTitle (plotTitle);

// Make the graphics file, which the plot file will create when it
// is used with Gnuplot, be a PNG file.
plot.SetTerminal ("png");

// Set the labels for each axis.
plot.SetLegend ("X Values", "Y Values");

// Set the range for the x axis.
plot.AppendExtra ("set xrange [-6:+6]");

// Instantiate the dataset, set its title, and make the points be
// plotted along with connecting lines.
Gnuplot2dDataset dataset;
dataset.SetTitle (dataTitle);
dataset.SetStyle (Gnuplot2dDataset::LINES_POINTS);

double x;
double y;

// Create the 2-D dataset.
for (x = -5.0; x <= +5.0; x += 1.0)
  {
    // Calculate the 2-D curve
    //
    //            2
    //     y  =  x   .
    //
    y = x * x;

    // Add this point.
    dataset.Add (x, y);
  }

// Add the dataset to the plot.
plot.AddDataset (dataset);

// Open the plot file.
std::ofstream plotFile (plotFileName.c_str());

// Write the plot file.
plot.GenerateOutput (plotFile);

// Close the plot file.
plotFile.close ();
An Example 2-Dimensional Plot with Error Bars
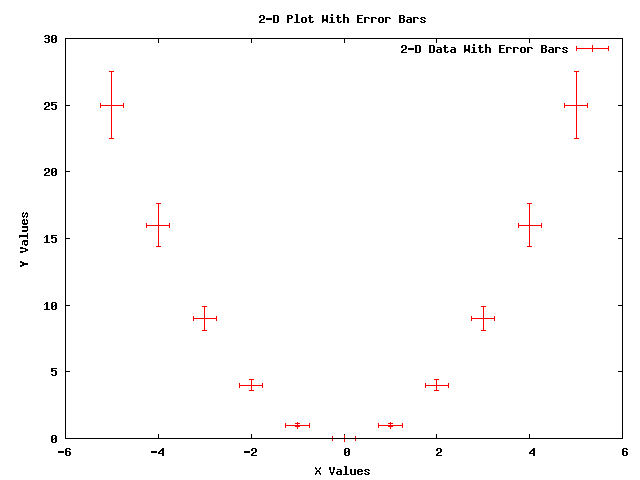
The following 2-Dimensional plot with error bars in the x and y directions

was created using the following code from gnuplot-example.cc:
std::string fileNameWithNoExtension = "plot-2d-with-error-bars";
std::string graphicsFileName        = fileNameWithNoExtension + ".png";
std::string plotFileName            = fileNameWithNoExtension + ".plt";
std::string plotTitle               = "2-D Plot With Error Bars";
std::string dataTitle               = "2-D Data With Error Bars";

// Instantiate the plot and set its title.
Gnuplot plot (graphicsFileName);
plot.SetTitle (plotTitle);

// Make the graphics file, which the plot file will create when it
// is used with Gnuplot, be a PNG file.
plot.SetTerminal ("png");

// Set the labels for each axis.
plot.SetLegend ("X Values", "Y Values");

// Set the range for the x axis.
plot.AppendExtra ("set xrange [-6:+6]");

// Instantiate the dataset, set its title, and make the points be
// plotted with no connecting lines.
Gnuplot2dDataset dataset;
dataset.SetTitle (dataTitle);
dataset.SetStyle (Gnuplot2dDataset::POINTS);

// Make the dataset have error bars in both the x and y directions.
dataset.SetErrorBars (Gnuplot2dDataset::XY);

double x;
double xErrorDelta;
double y;
double yErrorDelta;

// Create the 2-D dataset.
for (x = -5.0; x <= +5.0; x += 1.0)
  {
    // Calculate the 2-D curve
    //
    //            2
    //     y  =  x   .
    //
    y = x * x;

    // Make the uncertainty in the x direction be constant and make
    // the uncertainty in the y direction be a constant fraction of
    // y's value.
    xErrorDelta = 0.25;
    yErrorDelta = 0.1 * y;

    // Add this point with uncertainties in both the x and y
    // direction.
    dataset.Add (x, y, xErrorDelta, yErrorDelta);
  }

// Add the dataset to the plot.
plot.AddDataset (dataset);

// Open the plot file.
std::ofstream plotFile (plotFileName.c_str());

// Write the plot file.
plot.GenerateOutput (plotFile);

// Close the plot file.
plotFile.close ();
An Example 3-Dimensional Plot
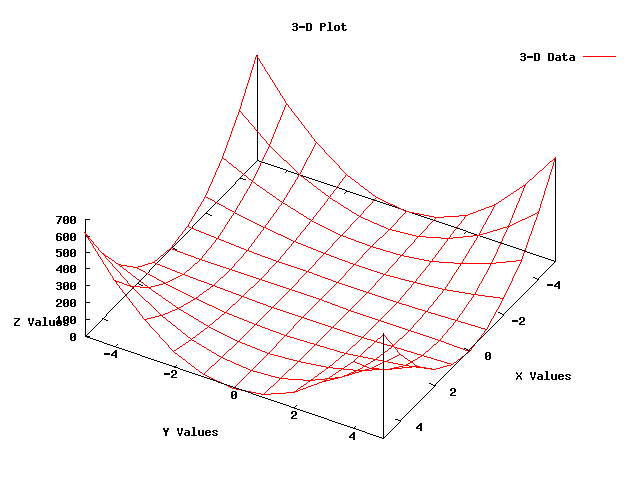
The following 3-Dimensional plot

was created using the following code from gnuplot-example.cc:
std::string fileNameWithNoExtension = "plot-3d";
std::string graphicsFileName        = fileNameWithNoExtension + ".png";
std::string plotFileName            = fileNameWithNoExtension + ".plt";
std::string plotTitle               = "3-D Plot";
std::string dataTitle               = "3-D Data";

// Instantiate the plot and set its title.
Gnuplot plot (graphicsFileName);
plot.SetTitle (plotTitle);

// Make the graphics file, which the plot file will create when it
// is used with Gnuplot, be a PNG file.
plot.SetTerminal ("png");

// Rotate the plot 30 degrees around the x axis and then rotate the
// plot 120 degrees around the new z axis.
plot.AppendExtra ("set view 30, 120, 1.0, 1.0");

// Make the zero for the z-axis be in the x-axis and y-axis plane.
plot.AppendExtra ("set ticslevel 0");

// Set the labels for each axis.
plot.AppendExtra ("set xlabel 'X Values'");
plot.AppendExtra ("set ylabel 'Y Values'");
plot.AppendExtra ("set zlabel 'Z Values'");

// Set the ranges for the x and y axis.
plot.AppendExtra ("set xrange [-5:+5]");
plot.AppendExtra ("set yrange [-5:+5]");

// Instantiate the dataset, set its title, and make the points be
// connected by lines.
Gnuplot3dDataset dataset;
dataset.SetTitle (dataTitle);
dataset.SetStyle ("with lines");

double x;
double y;
double z;

// Create the 3-D dataset.
for (x = -5.0; x <= +5.0; x += 1.0)
  {
    for (y = -5.0; y <= +5.0; y += 1.0)
      {
        // Calculate the 3-D surface
        //
        //            2      2
        //     z  =  x   *  y   .
        //
        z = x * x * y * y;

        // Add this point.
        dataset.Add (x, y, z);
      }

    // The blank line is necessary at the end of each x value's data
    // points for the 3-D surface grid to work.
    dataset.AddEmptyLine ();
  }

// Add the dataset to the plot.
plot.AddDataset (dataset);

// Open the plot file.
std::ofstream plotFile (plotFileName.c_str());

// Write the plot file.
plot.GenerateOutput (plotFile);

// Close the plot file.
plotFile.close ();
