NAME
v.segment - Creates points/segments from input vector lines and positions.KEYWORDS
vector, geometry, node, point, segment, vertexSYNOPSIS
Flags:
- --overwrite
- Allow output files to overwrite existing files
- --help
- Print usage summary
- --verbose
- Verbose module output
- --quiet
- Quiet module output
- --ui
- Force launching GUI dialog
Parameters:
- input=name [required]
- Name of input vector lines map
- Or data source for direct OGR access
- layer=string
- Layer number or name
- Vector features can have category values in different layers. This number determines which layer to use. When used with direct OGR access this is the layer name.
- Default: 1
- output=name [required]
- Name for output vector map
- rules=name
- Name of file containing segment rules
- '-' for standard input
Table of contents
DESCRIPTION
v.segment generates segments or points from input lines and from positions read from a text file or 'stdin'. It includes the creation of parallel lines or points in given destination from the line.The format is:
P <point id>   <line cat> <offset> [<side offset>]
L <segment id> <line cat> <start offset> <end offset> [<side offset>]
The user could send to stdin something like:
P 1 356 24.56
P 2 495 12.31
P 3 500 -12.31
P 4 510 -20%
...
NOTES
A segment is only created for the first line found of the specified category.Points are generated along the lines at the given distance(s) or percent(s) of the line length from the beginning or end, if offsets are negative, of the vector line.
The side offset is the orthogonal distance from the line. Positive side offsets are to the right side of the line going forward, negative offsets are to the left (d.vect with display=shape,dir shows the direction of vector lines). As the segment distance is measured along the original line, side-offset lines will be longer than the start-end segment distance for outside corners of curving lines, and shorter for inside corners.
All offsets are measured in map units (see "g.proj -p") or percents of the line length, if followed by a % character.
To place a point in the middle of a line, 50% offset can be used or the v.to.db module may be used to find the line's length. Then half of that distance can be used as the along-line offset.
EXAMPLES
The examples are based on the North Carolina sample location.Extraction of a line segment
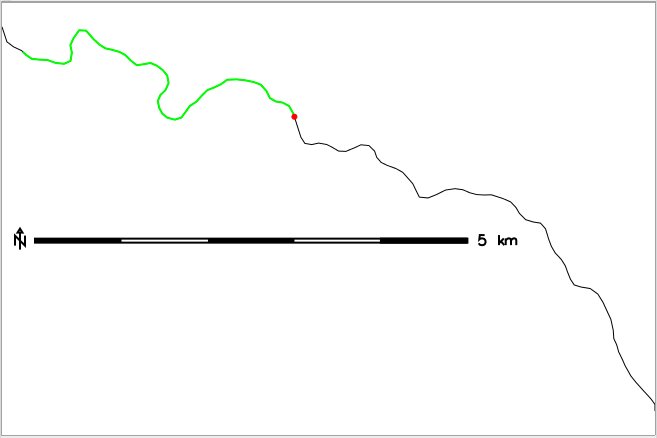
Extract line segment from 400m to 5000m from beginning of line 1:# extract lines from railroad map: v.extract input=railroads output=myrr cats=1 # join segments into polyline and reassign category numbers v.build.polylines myrr out=myrr_pol v.category input=myrr_pol output=myrailroads option=add # zoom to an area of interest g.region vector=myrailroads -p # show line, category, direction (to find the beginning) d.mon wx0 d.vect map=myrailroads display=shape,cat,dir lsize=12 # extract line segment from 400m to 5000m from beginning of line 1 echo "L 1 1 400 5000" | v.segment input=myrailroads output=myrailroads_segl d.erase d.vect map=myrailroads d.vect map=myrailroads_segl col=green width=2 # set node at 5000m from beginning of line 1 echo "P 1 1 5000" | v.segment input=myrailroads output=myrailroads_segp d.vect map=myrailroads_segp icon=basic/circle color=red fcolor=red size=5

Extract line segment from 400m to 5000m from beginning of line 1
Parallel line segments
Creation of parallel, 1km long line segments along the first 8km of track, offset 500m to the left of the tracks:v.segment input=myrailroads output=myrailroads_segl_side << EOF L 1 1 1000 2000 -500 L 2 1 3000 4000 -500 L 3 1 5000 6000 -500 L 4 1 7000 8000 -500 EOF d.erase d.vect map=myrailroads display=shape,dir d.vect -c map=myrailroads_segl_side width=2
Points equidistant along the tracks
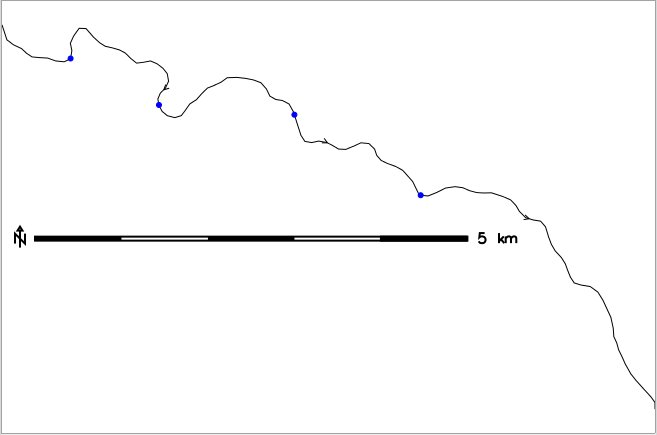
Creation of a series of points, spaced every 2km along the tracks:v.segment input=myrailroads output=myrailroads_pt2km << EOF P 1 1 1000 P 2 1 3000 P 3 1 5000 P 4 1 7000 EOF d.erase d.vect map=myrailroads display=shape,dir d.vect map=myrailroads_pt2km icon=basic/circle color=blue fcolor=blue size=5

A series of points, spaced every 2km along the tracks
Points equidistant along and offset the tracks
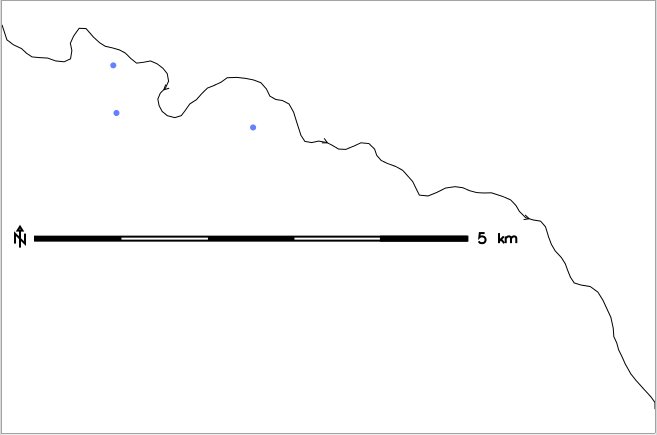
Creation of a series of points, spaced every 2km along the tracks, offset 500m to the right:v.segment input=myrailroads output=myrailroads_pt2kmO500m << EOF P 1 1 1000 500 P 2 1 3000 500 P 3 1 5000 500 P 4 1 7000 500 EOF d.erase d.vect map=myrailroads display=shape,dir d.vect map=myrailroads_pt2kmO500m icon=basic/circle color=aqua fcolor=aqua size=5

A series of points, spaced every 2km along the tracks, offset 500m to the right
Points equidistant in percent along and offset the tracks
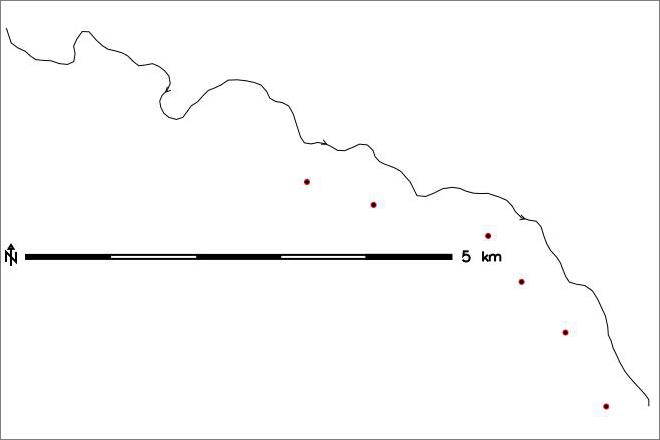
Creation of a series of points, spaced every 10% of the line's length along the tracks from the end of the line up to the middle point, offset 500m to the right:v.segment input=myrailroads output=myrailroads_pt10pctO500m << EOF P 1 1 -0% 500 P 2 1 -10% 500 P 3 1 -20% 500 P 4 1 -30% 500 P 5 1 -40% 500 P 6 1 -50% 500 EOF d.erase d.vect map=myrailroads display=shape,dir d.vect map=myrailroads_pt10pctO500m icon=basic/circle color=red fcolor=black size=5

A series of points, spaced every 10% of the line's length along the tracks from the end of the line up to the middle point, offset 500m to the right
KNOWN ISSUES
There is a problem with side-offset parallel line generation for inside corners.SEE ALSO
LRS tutorial (Linear Referencing System),d.vect, v.build.polylines, v.lrs.segment, v.parallel, v.split, v.to.db, v.to.points
AUTHOR
Radim Blazek, ITC-Irst, Trento, ItalySOURCE CODE
Available at: v.segment source code (history)
Accessed: Sunday Jan 22 07:37:12 2023
Main index | Vector index | Topics index | Keywords index | Graphical index | Full index
© 2003-2023 GRASS Development Team, GRASS GIS 8.2.1 Reference Manual