Implementation of PeakFinder8 on GPU#
The peakfinder8 is the core algorithm for assessing the quality of a single frame in serial crystallography and was initially implemented in C++ within the cheetah [1]
This algorithm is called peakfinder8 because it consits of 8 subsequent steps perfromed on evry single frame:
perfrom the azimuthal integration with uncertainety propagation
discard pixels which differ by more than N-sigma from the mean and cycle to 1 about 3 to 5 times
pick all pixels with I > mean + min(N*sigma, noise)
such pixel is a peak if it is the maximum of the 3x3 or 5x5 patch and there are connected pixels in the patch with their intensity above the previous threshold.
subtract background and sum the signal over the patch
return the index of the peak, the integrated signal and the center of mass of the peak
exclude neighboring peaks (un-implemented)
Validate the frame if there are enough peaks found.
There is a attempt to implement peakfinder8 on GPU within the pyFAI. The steps 1+2 correspond to the sigma-clipping algorithm and enforce an azimuthal, normal distribution for the background.
This tutorial demontrates how peak-finding can be called from Jupyter notebooks and what are the performances expected. Finally, the performances will be compared with the reference implementation.
[1] A. Barty, R. A. Kirian, F. R. N. C. Maia, M. Hantke, C. H. Yoon, T. A. White, and H. N. Chapman, “Cheetah: software for high-throughput reduction and analysis of serial femtosecond x-ray diffraction data”, J Appl Crystallogr, vol. 47, pp. 1118-1131 (2014)
[1]:
%matplotlib inline
# use `widget` for better user experience; `inline` is for documentation generation
[2]:
import os
import sys
import shutil
import posixpath
import numpy
import glob
from matplotlib.pylab import subplots
import fabio
import pyFAI, pyFAI.azimuthalIntegrator
from pyFAI.gui import jupyter
from pyFAI import units
import pyopencl
from pyFAI.opencl.peak_finder import OCL_PeakFinder
from pyFAI.test.utilstest import UtilsTest
from pyFAI.containers import ErrorModel
import time
start_time = time.perf_counter()
os.environ["PYOPENCL_COMPILER_OUTPUT"] = "1"
WARNING:pyFAI.DEPRECATION:Module pyFAI.azimuthalIntegrator is deprecated since pyFAI version 2024.10. Use 'pyFAI.integrator.azimuthal' instead.
  File "<frozen runpy>", line 198, in _run_module_as_main
  File "<frozen runpy>", line 88, in _run_code
  File "/home/jerome/.venv/py311/lib/python3.11/site-packages/ipykernel_launcher.py", line 17, in <module>
    app.launch_new_instance()
  File "/home/jerome/.venv/py311/lib/python3.11/site-packages/traitlets/config/application.py", line 1075, in launch_instance
    app.start()
  File "/home/jerome/.venv/py311/lib/python3.11/site-packages/ipykernel/kernelapp.py", line 736, in start
    self.io_loop.start()
  File "/home/jerome/.venv/py311/lib/python3.11/site-packages/tornado/platform/asyncio.py", line 195, in start
    self.asyncio_loop.run_forever()
  File "/usr/lib/python3.11/asyncio/base_events.py", line 607, in run_forever
    self._run_once()
  File "/usr/lib/python3.11/asyncio/base_events.py", line 1922, in _run_once
    handle._run()
  File "/usr/lib/python3.11/asyncio/events.py", line 80, in _run
    self._context.run(self._callback, *self._args)
  File "/home/jerome/.venv/py311/lib/python3.11/site-packages/ipykernel/kernelbase.py", line 516, in dispatch_queue
    await self.process_one()
  File "/home/jerome/.venv/py311/lib/python3.11/site-packages/ipykernel/kernelbase.py", line 505, in process_one
    await dispatch(*args)
  File "/home/jerome/.venv/py311/lib/python3.11/site-packages/ipykernel/kernelbase.py", line 412, in dispatch_shell
    await result
  File "/home/jerome/.venv/py311/lib/python3.11/site-packages/ipykernel/kernelbase.py", line 740, in execute_request
    reply_content = await reply_content
  File "/home/jerome/.venv/py311/lib/python3.11/site-packages/ipykernel/ipkernel.py", line 422, in do_execute
    res = shell.run_cell(
  File "/home/jerome/.venv/py311/lib/python3.11/site-packages/ipykernel/zmqshell.py", line 546, in run_cell
    return super().run_cell(*args, **kwargs)
  File "/home/jerome/.venv/py311/lib/python3.11/site-packages/IPython/core/interactiveshell.py", line 3075, in run_cell
    result = self._run_cell(
  File "/home/jerome/.venv/py311/lib/python3.11/site-packages/IPython/core/interactiveshell.py", line 3130, in _run_cell
    result = runner(coro)
  File "/home/jerome/.venv/py311/lib/python3.11/site-packages/IPython/core/async_helpers.py", line 128, in _pseudo_sync_runner
    coro.send(None)
  File "/home/jerome/.venv/py311/lib/python3.11/site-packages/IPython/core/interactiveshell.py", line 3334, in run_cell_async
    has_raised = await self.run_ast_nodes(code_ast.body, cell_name,
  File "/home/jerome/.venv/py311/lib/python3.11/site-packages/IPython/core/interactiveshell.py", line 3517, in run_ast_nodes
    if await self.run_code(code, result, async_=asy):
  File "/home/jerome/.venv/py311/lib/python3.11/site-packages/IPython/core/interactiveshell.py", line 3577, in run_code
    exec(code_obj, self.user_global_ns, self.user_ns)
  File "/tmp/ipykernel_2906315/328207621.py", line 9, in <module>
    import pyFAI, pyFAI.azimuthalIntegrator
  File "<frozen importlib._bootstrap>", line 1178, in _find_and_load
  File "<frozen importlib._bootstrap>", line 1149, in _find_and_load_unlocked
  File "<frozen importlib._bootstrap>", line 690, in _load_unlocked
  File "<frozen importlib._bootstrap_external>", line 940, in exec_module
[3]:
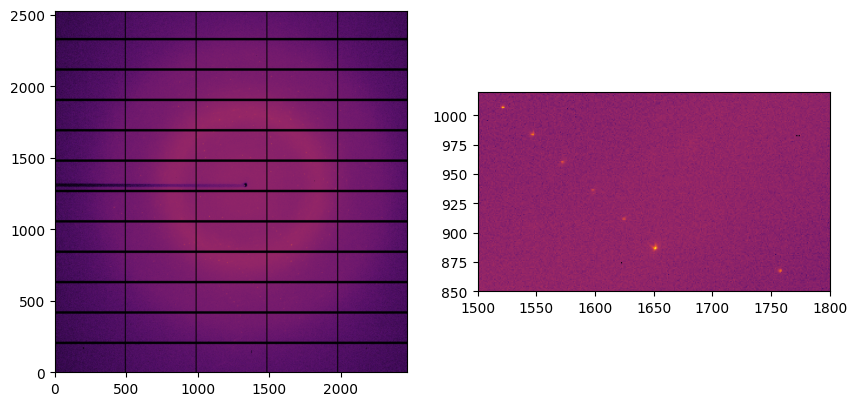
fimg = fabio.open(UtilsTest.getimage("Pilatus6M.cbf"))
mask = numpy.logical_or(fimg.data>65000, fimg.data<0)
print(f"Number of masked pixels: {mask.sum()}")
Number of masked pixels: 527055
[4]:
det = pyFAI.detector_factory("Pilatus6M")
det.mask = mask
[5]:
dimg = fimg.data.copy()
dimg[mask] = 0

fig,ax = subplots(1, 2, figsize=(10,5))
jupyter.display(dimg, ax=ax[0])
jupyter.display(dimg, ax=ax[1])
ax[1].set_xlim(1500, 1800)
ax[1].set_ylim(850, 1020)
pass
[6]:
ponifile = UtilsTest.getimage("Pilatus6M.poni")
ai = pyFAI.load(ponifile)
ai.detector = det
print(ai)
Detector Pilatus 6M      PixelSize= 172µm, 172µm         BottomRight (3)
Wavelength= 1.033200e-10 m
SampleDetDist= 3.000000e-01 m   PONI= 2.254060e-01, 2.285880e-01 m      rot1=0.000000  rot2=0.000000  rot3=0.000000 rad
DirectBeamDist= 300.000 mm      Center: x=1329.000, y=1310.500 pix      Tilt= 0.000° tiltPlanRotation= 0.000° 𝛌= 1.033Å
[7]:
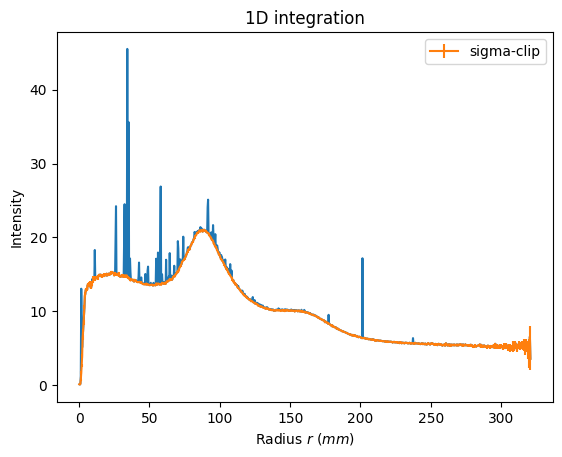
kwargs = {"data": fimg.data,
          "npt":1000,
          "method": ("no", "csr", "opencl"),
          "polarization_factor": 0.99,
          "unit":"r_mm", }
ax = jupyter.plot1d(ai.integrate1d(**kwargs))
ax.errorbar(*ai.sigma_clip_ng(error_model="azimuthal", **kwargs), label="sigma-clip")
_=ax.legend()
[8]:
ctx = pyopencl.create_some_context(interactive=False)
print(f"Using {ctx.devices[0].name}")
Using NVIDIA GeForce GT 1030
[9]:
unit = units.to_unit("r_mm")
image_size = det.shape[0] * det.shape[1]
integrator = ai.setup_sparse_integrator(ai.detector.shape, 1000, mask=mask, unit=unit, split="no", algo="CSR", scale=False)
polarization = ai._cached_array["last_polarization"]
pf = OCL_PeakFinder(integrator.lut,
                     image_size=image_size,
                     bin_centers=integrator.bin_centers,
                     radius=ai._cached_array[unit.name.split("_")[0] + "_center"],
                     mask=mask,
                     ctx=ctx,
#                      block_size=512,
                     unit=unit)
kwargs = {"data":fimg.data,
          "error_model": ErrorModel.parse("azimuthal"),
          "polarization":polarization.array,
          "polarization_checksum": polarization.checksum}
print(f"Number of high intensity pixels at stage #3:\t{pf.count_intense(**kwargs ,cycle=5, cutoff_pick=3.0)}\n\
Number of peaks identified at stage #6:\t\t{pf._count_peak(**kwargs, cycle=5, cutoff_peak=3.0)}")
Number of high intensity pixels at stage #3:    19464
Number of peaks identified at stage #6:         340
[10]:
from silx.opencl.processing import ProfileDescription, EventDescription

def average_opencl_runtime(events):
    stats = {}
    total_time = 0.0
    for e in events:
        if isinstance(e, ProfileDescription):
            name = e[0]
            t0 = e[1]
            t1 = e[2]
        elif isinstance(e, EventDescription) or "__len__" in dir(e) and len(e) == 2:
            name = e[0]
            pr = e[1].profile
            t0 = pr.start
            t1 = pr.end
        else:
            name = "?"
            t0 = e.profile.start
            t1 = e.profile.end

        et = 1e-6 * (t1 - t0)
        total_time += et
        if name in stats:
            stats[name].append(et)
        else:
            stats[name] = [et]
    return total_time/max(len(stats[i]) for i in stats)
[11]:
# Performance measurement of the pixel recording (stage 1->3)
pf.reset_log()
pf.set_profiling(True)
timeit_count_intense = %timeit -o pf.count(**kwargs, cycle=3, cutoff_pick=3, noise=1)
print("\n".join(pf.log_profile(True)))
print(f"Overhead due to Python: {(0.001*average_opencl_runtime(pf.events)/timeit_count_intense.average-1.0)*-100:.1f}%")
pf.set_profiling(False)
48.3 ms ± 986 μs per loop (mean ± std. dev. of 7 runs, 10 loops each)

OpenCL kernel profiling statistics in milliseconds for: OCL_PeakFinder
                                       Kernel name (count):      min   median      max     mean      std
                               copy H->D image_raw (   81):    7.775    7.792    8.008    7.820    0.059
                                         memset_ng (   81):    0.002    0.003    0.012    0.005    0.003
                                     corrections4a (   81):    3.770    3.778    4.969    3.907    0.280
                                   csr_sigma_clip4 (   81):   29.543   30.297   42.374   30.689    1.749
                                    memset counter (   81):    0.002    0.002    0.003    0.003    0.001
                                      find_intense (   81):    5.146    5.152    7.506    5.320    0.390
                                 copy D->H counter (   81):    0.001    0.001    0.006    0.001    0.001
________________________________________________________________________________
                       Total OpenCL execution time        : 3867.297ms
Overhead due to Python: 1.2%
The overhead from calling OpenCL from Python is as low as 8%
[12]:
# Performance measurement of the pixel recording (stage 1->6)
pf.reset_log()
pf.set_profiling(True)
timeit_gpu = %timeit -o pf.peakfinder8(**kwargs, cycle=3, cutoff_peak=3, noise=1, connected=3, patch_size=3)
print("\n".join(pf.log_profile(True)))
print(f"Overhead due to Python: {(0.001*average_opencl_runtime(pf.events)/timeit_gpu.average-1.0)*-100:.1f}%")
pf.set_profiling(False)
72 ms ± 82.6 μs per loop (mean ± std. dev. of 7 runs, 10 loops each)

OpenCL kernel profiling statistics in milliseconds for: OCL_PeakFinder
                                       Kernel name (count):      min   median      max     mean      std
                               copy H->D image_raw (   81):    7.773    7.798    8.001    7.817    0.053
                                         memset_ng (   81):    0.002    0.004    0.014    0.006    0.003
                                     corrections4a (   81):    3.772    3.779    4.228    3.840    0.136
                                   csr_sigma_clip4 (   81):   29.882   30.274   30.401   30.232    0.129
                                    memset counter (   81):    0.002    0.003    0.003    0.003    0.001
                                        peakfinder (   81):   29.101   29.490   29.802   29.513    0.184
                                 copy D->H counter (   81):    0.001    0.001    0.003    0.001    0.000
                          copy D->H peak positions (   81):    0.001    0.001    0.001    0.001    0.000
                         copy D->H peak descriptor (   81):    0.001    0.001    0.002    0.001    0.000
________________________________________________________________________________
                       Total OpenCL execution time        : 5784.563ms
Overhead due to Python: 0.8%
The overhead from calling OpenCL from Python is as low as 10% (lower performances due to memory allocation)
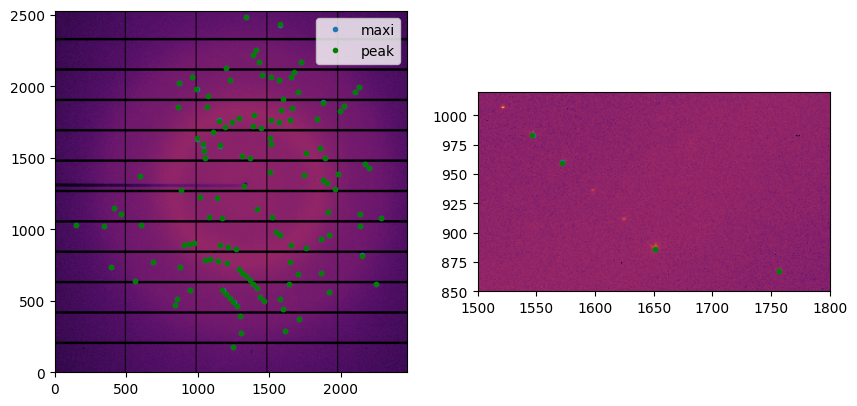
[13]:
# Visualization of the performances:
res8 = pf.peakfinder8(fimg.data, error_model="azimuthal",
                      cycle=3, cutoff_peak=3, noise=2, connected=9, patch_size=5)
print(len(res8), res8.dtype)
128 [('index', '<i4'), ('intensity', '<f4'), ('sigma', '<f4'), ('pos0', '<f4'), ('pos1', '<f4')]
[14]:
width = fimg.shape[-1]
y = res8["index"] // width
x = res8["index"] % width
fig, ax = subplots(1, 2, figsize=(10,5))
jupyter.display(dimg, ax=ax[0])
jupyter.display(dimg, ax=ax[1])
ax[0].plot(x, y, ".", label="maxi")
ax[1].plot(x, y, ".")
ax[0].plot(res8["pos1"], res8["pos0"], ".g", label="peak")
ax[1].plot(res8["pos1"], res8["pos0"], ".g")
ax[1].set_xlim(1500, 1800)
ax[1].set_ylim(850, 1020)
_=ax[0].legend()
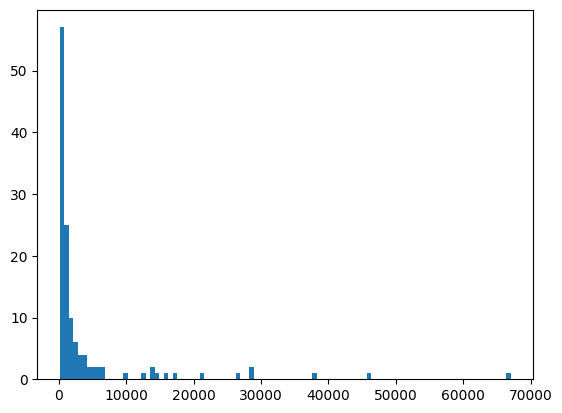
[15]:
fig,ax = subplots()
res=ax.hist(res8["intensity"], 100, )
Comparison with the original “peakfinder8”#
This algorithm has a python wrapper available from tjlane/peakfinder8
The next cells installs a local version of the Cython-binded peakfinder8 from github.
Nota: This is a quick & dirty solution.
[16]:
targeturl = "https://github.com/kif/peakfinder8"
targetdir = posixpath.split(targeturl)[-1]
if os.path.exists(targetdir):
    shutil.rmtree(targetdir, ignore_errors=True)
pwd = os.getcwd()
try:
    os.system("git clone " + targeturl)
    os.chdir(targetdir)
    os.system(f"'{sys.executable}' setup.py build")
finally:
    os.chdir(pwd)
sys.path.append(pwd+"/"+glob.glob(f"{targetdir}/build/lib*")[0])
from ssc.peakfinder8_extension import peakfinder_8
Clonage dans 'peakfinder8'...
/home/jerome/.venv/py311/lib/python3.11/site-packages/Cython/Compiler/Main.py:381: FutureWarning: Cython directive 'language_level' not set, using '3str' for now (Py3). This has changed from earlier releases! File: /home/jerome/workspace-ssd/pyFAI/doc/source/usage/tutorial/Separation/peakfinder8/ext/peakfinder8/peakfinder8_extension.pyx
  tree = Parsing.p_module(s, pxd, full_module_name)
Compiling ext/peakfinder8/peakfinder8_extension.pyx because it changed.
[1/1] Cythonizing ext/peakfinder8/peakfinder8_extension.pyx
In file included from /home/jerome/.venv/py311/lib/python3.11/site-packages/numpy/_core/include/numpy/ndarraytypes.h:1913,
                 from /home/jerome/.venv/py311/lib/python3.11/site-packages/numpy/_core/include/numpy/ndarrayobject.h:12,
                 from /home/jerome/.venv/py311/lib/python3.11/site-packages/numpy/_core/include/numpy/arrayobject.h:5,
                 from ext/peakfinder8/peakfinder8_extension.cpp:1270:
/home/jerome/.venv/py311/lib/python3.11/site-packages/numpy/_core/include/numpy/npy_1_7_deprecated_api.h:17:2: warning: #warning "Using deprecated NumPy API, disable it with " "#define NPY_NO_DEPRECATED_API NPY_1_7_API_VERSION" [-Wcpp]
   17 | #warning "Using deprecated NumPy API, disable it with " \
      |  ^~~~~~~
ext/peakfinder8/peakfinders.cpp: In function ‘int peakfinder3(tPeakList*, float*, char*, long int, long int, long int, long int, float, float, long int, long int, long int)’:
ext/peakfinder8/peakfinders.cpp:319:57: warning: variable ‘thisr’ set but not used [-Wunused-but-set-variable]
  319 |                                                 float   thisr;
      |                                                         ^~~~~
ext/peakfinder8/peakfinders.cpp:176:17: warning: variable ‘total’ set but not used [-Wunused-but-set-variable]
  176 |         float   total;
      |                 ^~~~~
ext/peakfinder8/peakfinders.cpp: In function ‘int peakfinder8(tPeakList*, float*, char*, float*, long int, long int, long int, long int, float, float, long int, long int, long int)’:
ext/peakfinder8/peakfinders.cpp:463:17: warning: variable ‘total’ set but not used [-Wunused-but-set-variable]
  463 |         float   total;
      |                 ^~~~~
ext/peakfinder8/peakfinders.cpp:507:17: warning: variable ‘lminr’ set but not used [-Wunused-but-set-variable]
  507 |         long    lminr, lmaxr;
      |                 ^~~~~
ext/peakfinder8/peakfinders.cpp:522:42: warning: argument 1 value ‘18446744072709551617’ exceeds maximum object size 9223372036854775807 [-Walloc-size-larger-than=]
  522 |         float   *rsigma = (float*) calloc(lmaxr, sizeof(float));
      |                                    ~~~~~~^~~~~~~~~~~~~~~~~~~~~~
In file included from /usr/include/c++/12/bits/std_abs.h:38,
                 from /usr/include/c++/12/cmath:47,
                 from /usr/include/c++/12/math.h:36,
                 from ext/peakfinder8/peakfinders.cpp:5:
/usr/include/stdlib.h:556:14: note: in a call to allocation function ‘void* calloc(size_t, size_t)’ declared here
  556 | extern void *calloc (size_t __nmemb, size_t __size)
      |              ^~~~~~
ext/peakfinder8/peakfinders.cpp:523:43: warning: argument 1 value ‘18446744072709551617’ exceeds maximum object size 9223372036854775807 [-Walloc-size-larger-than=]
  523 |         float   *roffset = (float*) calloc(lmaxr, sizeof(float));
      |                                     ~~~~~~^~~~~~~~~~~~~~~~~~~~~~
/usr/include/stdlib.h:556:14: note: in a call to allocation function ‘void* calloc(size_t, size_t)’ declared here
  556 | extern void *calloc (size_t __nmemb, size_t __size)
      |              ^~~~~~
ext/peakfinder8/peakfinders.cpp:524:41: warning: argument 1 value ‘18446744072709551617’ exceeds maximum object size 9223372036854775807 [-Walloc-size-larger-than=]
  524 |         long    *rcount = (long*) calloc(lmaxr, sizeof(long));
      |                                   ~~~~~~^~~~~~~~~~~~~~~~~~~~~
/usr/include/stdlib.h:556:14: note: in a call to allocation function ‘void* calloc(size_t, size_t)’ declared here
  556 | extern void *calloc (size_t __nmemb, size_t __size)
      |              ^~~~~~
ext/peakfinder8/peakfinders.cpp:525:46: warning: argument 1 value ‘18446744072709551617’ exceeds maximum object size 9223372036854775807 [-Walloc-size-larger-than=]
  525 |         float   *rthreshold = (float*) calloc(lmaxr, sizeof(float));
      |                                        ~~~~~~^~~~~~~~~~~~~~~~~~~~~~
/usr/include/stdlib.h:556:14: note: in a call to allocation function ‘void* calloc(size_t, size_t)’ declared here
  556 | extern void *calloc (size_t __nmemb, size_t __size)
      |              ^~~~~~
[17]:
%%time
#Create some compatibility layer:
img = fimg.data.astype("float32")
r = ai._cached_array['r_center'].astype("float32")
# r = numpy.ones_like(img)
imask = (1-mask).astype("int8")
max_num_peaks = 1000
asic_nx = img.shape[-1]
asic_ny = img.shape[0]
nasics_x = 1
nasics_y = 1
adc_threshold = 2.0
minimum_snr = 3.0
min_pixel_count = 9
max_pixel_count = 999
local_bg_radius = 3
accumulated_shots = 1
min_res = 0
max_res = 3000
CPU times: user 7.91 ms, sys: 8.49 ms, total: 16.4 ms
Wall time: 15.4 ms
[18]:
%%time
ref = peakfinder_8(max_num_peaks,
                   img, imask, r,
                   asic_nx, asic_ny, nasics_x, nasics_y,
                   adc_threshold, minimum_snr,
                   min_pixel_count, max_pixel_count, local_bg_radius)
CPU times: user 156 ms, sys: 3.98 ms, total: 160 ms
Wall time: 159 ms
[19]:
timeit_cpu = %timeit -o peakfinder_8(max_num_peaks, img, imask, r, asic_nx, asic_ny, nasics_x, nasics_y, adc_threshold, minimum_snr,min_pixel_count, max_pixel_count, local_bg_radius)
153 ms ± 598 μs per loop (mean ± std. dev. of 7 runs, 10 loops each)
[20]:
print("Number of peak found: ", len(ref[0]), len(ref[1]), len(ref[2]))
print("Speed up of GPU vs CPU: ", timeit_cpu.best/timeit_gpu.best)
Number of peak found:  995 995 995
Speed up of GPU vs CPU:  2.112533195176765
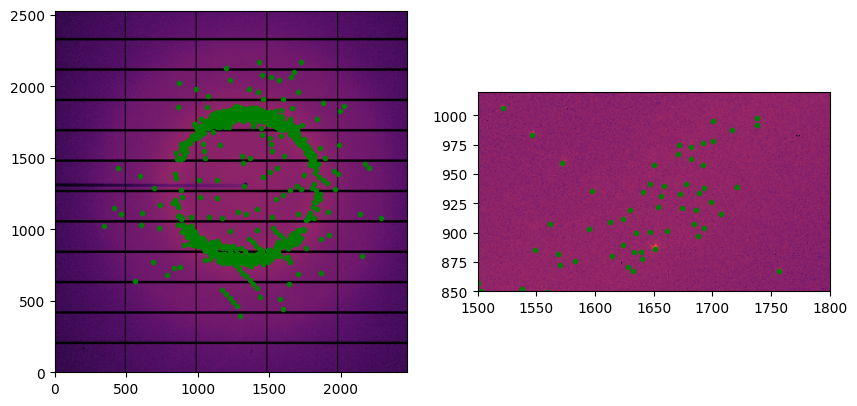
[21]:
#Display the peaks
fig, ax = subplots(1, 2, figsize=(10,5))
jupyter.display(dimg, ax=ax[0])
jupyter.display(dimg, ax=ax[1])
ax[0].plot(ref[0], ref[1], ".g")
ax[1].plot(ref[0], ref[1], ".g")
ax[1].set_xlim(1500, 1800)
ax[1].set_ylim(850, 1020)
pass
Conclusion#
The re-implementation of peakfinder8 in pyFAI takes advantage of the many parallel threads available on GPU which makes it 20 times faster than the original implementation in C++. Despite this algorithm has been re-designed for GPU, it can also run on CPU but it would not be optimized there thus it is likely to be slower.
The results obtained with the Python/OpenCL implementation looks better, this is probably due to a slightly different threshold \(I > mean + max(N*sigma, noise)\) instead of \(I > max(noise, mean + N*sigma)\).
[22]:
print(f"Total execution time: {time.perf_counter()-start_time:.3f}s")
Total execution time: 49.475s