Calibration of a detector on a translation table#
The aim of this document is to explain how to use pyFAI.goniometer for calibrating the position detector from the translation table encoders.
Those data have been acquired at ESRF-ID29 in summer 2013 on a Pilatus 6M using Ceria (CeO2) as calibrant. Seven images have been acquired with the detector moved between 15 cm and 45 cm from the sample position. A prior calibration has been performed using the MX-calibrate script from the pyFAI suite. The control points extracted during this initial calibration have been used as a starting point for this calibration.
The raw data files are available at: http://www.silx.org/pub/pyFAI/gonio/MX-ceria/
[1]:
# Initialization of the plotting library for use in the Jupyter notebook

%matplotlib inline
import numpy
from matplotlib.pyplot import subplots
[2]:
# Loading of a few libraries

import time
start_time =time.perf_counter()
import os
import fabio
import pyFAI
from  pyFAI.goniometer import GeometryTransformation, GoniometerRefinement, Goniometer
from pyFAI.gui import jupyter

print("PyFAI version:", pyFAI.version)
PyFAI version: 2025.1.0-dev0
[3]:
#Download all images
#Nota: comment-out to configure a proxy if you are behind a firewall
#os.environ["http_proxy"] = "http://proxy.company.com:3128"
from silx.resources import ExternalResources
downloader = ExternalResources("pyFAI", "http://www.silx.org/pub/pyFAI/testimages", "PYFAI_DATA")
all_files = downloader.getdir("MX_ceria.tar.bz2")
print(os.linesep.join(os.path.basename(i) for i in all_files))
MX_ceria
ceria_300_1_0001.npt
ceria_150_1_0001.cbf
ceria_200_1_0001.npt
ceria_250_1_0001.cbf
ceria_250_1_0001.npt
ceria_400_1_0001.cbf
ceria_400_1_0001.npt
ceria_450_1_0001.cbf
ceria_150_1_0001.poni
ceria_150_1_0001.npt
ceria_200_1_0001.poni
ceria_350_1_0001.poni
ceria_300_1_0001.cbf
ceria_450_1_0001.npt
ceria_250_1_0001.poni
ceria_350_1_0001.cbf
ceria_350_1_0001.npt
ceria_400_1_0001.poni
ceria_450_1_0001.poni
ceria_200_1_0001.cbf
ceria_300_1_0001.poni
[4]:
# Loading of the list of files, and display of the first one with its headers
image_files = [i for i in all_files if i.endswith(".cbf")]
image_files.sort()
print("List of images: " + ", ".join(image_files) + "." + os.linesep)
fimg = fabio.open(image_files[0])
print("Image headers:")
for key, value in fimg.header.items():
print("%s: %s"%(key,value))
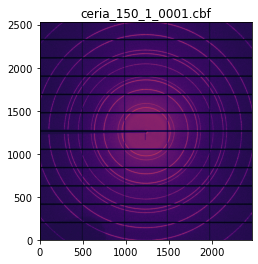
jupyter.display(fimg.data, label=os.path.basename(fimg.filename))
List of images: /tmp/pyFAI_testdata_kieffer/MX_ceria.tar.bz2__content/MX_ceria/ceria_150_1_0001.cbf, /tmp/pyFAI_testdata_kieffer/MX_ceria.tar.bz2__content/MX_ceria/ceria_200_1_0001.cbf, /tmp/pyFAI_testdata_kieffer/MX_ceria.tar.bz2__content/MX_ceria/ceria_250_1_0001.cbf, /tmp/pyFAI_testdata_kieffer/MX_ceria.tar.bz2__content/MX_ceria/ceria_300_1_0001.cbf, /tmp/pyFAI_testdata_kieffer/MX_ceria.tar.bz2__content/MX_ceria/ceria_350_1_0001.cbf, /tmp/pyFAI_testdata_kieffer/MX_ceria.tar.bz2__content/MX_ceria/ceria_400_1_0001.cbf, /tmp/pyFAI_testdata_kieffer/MX_ceria.tar.bz2__content/MX_ceria/ceria_450_1_0001.cbf.

Image headers:
_array_data.header_contents: # Detector: PILATUS 6M, S/N 60-0104, ESRF ID29
# 2013/Aug/29 17:26:59.699
# Pixel_size 172e-6 m x 172e-6 m
# Silicon sensor, thickness 0.000320 m
# Start_angle 0.000000 deg.
# Exposure_time 0.037000 s
# Exposure_period 0.040000 s
# Tau = 0 s
# Count_cutoff 1048500
# Threshold_setting 7612 eV
# N_excluded_pixels = 321
# Excluded_pixels:  badpix_mask.tif
# Flat_field:  (nil)
# Trim_directory: (nil)
# Wavelength 0.972386 A
# Detector_distance 0.150000 m
# Energy_range (0, 0) eV
# Detector_Voffset 0.0000 m
# Beam_xy (1230.90, 1254.09) pixels
# Flux 2.823146e+11 ph/s
# Transmission 20.1173
# Angle_increment 1.0000 deg.
# Detector_2theta 0.0000 deg.
# Polarization 0.99
# Alpha 0.0000 deg.
# Kappa 0.0020 deg.
# Phi 0.0000 deg.
# Chi 0.0000 deg.
# Oscillation_axis omega
# N_oscillations 1
# file_comments
Content-Type: application/octet-stream;
conversions: x-CBF_BYTE_OFFSET
Content-Transfer-Encoding: BINARY
X-Binary-Size: 6262451
X-Binary-ID: 0
X-Binary-Element-Type: signed 32-bit integer
X-Binary-Element-Byte-Order: LITTLE_ENDIAN
Content-MD5: BIfsFrKJBFklJn97/hjO/A==
X-Binary-Number-of-Elements: 6224001
X-Binary-Size-Fastest-Dimension: 2463
X-Binary-Size-Second-Dimension: 2527
X-Binary-Size-Padding: 128
[4]:
<Axes: title={'center': 'ceria_150_1_0001.cbf'}>
[5]:
# Definition of the geometry translation function:

geotrans = GeometryTransformation(param_names = ["dist_offset", "dist_scale",
                                                 "poni1", "poni2", "rot1","rot2"],
                                  dist_expr="pos * dist_scale + dist_offset",
                                  poni1_expr="poni1",
                                  poni2_expr="poni2",
                                  rot1_expr="rot1",
                                  rot2_expr="rot2",
                                  rot3_expr="0.0")


# Definition of the function reading the detector position from the header of the image.

def get_distance(header):
    """Takes the header of the CBF-file and returns the distance of the detector"""
    dist = 0
    for line in header.get("_array_data.header_contents","").split("\n"):
        words = line.split()
        if words[1] == "Detector_distance":
            dist = float(words[2])
            break
    return dist

print("Distance:",get_distance(fimg.header))
Distance: 0.15
[6]:
# Definition of the detector, the calibrant and extraction of the wavelength used from the headers

pilatus = pyFAI.detector_factory("Pilatus6M")
CeO2 = pyFAI.calibrant.get_calibrant("CeO2")
for line in fimg.header.get("_array_data.header_contents","").split("\n"):
    words = line.split()
    if words[1] == "Wavelength":
        wavelength = float(words[2])*1e-10
        break
print("Wavelength:", wavelength)
CeO2.wavelength = wavelength
print(CeO2)
Wavelength: 9.72386e-11
CeO2 Calibrant with 42 reflections at wavelength 9.72386e-11
[7]:
# Definition of the geometry refinement: the parameter order is the same as the param_names

param = {"dist_offset":0,
         "dist_scale":1,
         "poni1":0.2,
         "poni2":0.2,
         "rot1":0,
         "rot2":0}

gonioref = GoniometerRefinement(param, #initial guess
                                pos_function=get_distance,
                                trans_function=geotrans,
                                detector=pilatus,
                                wavelength=wavelength)
print("Empty refinement object:")
print(gonioref)
Empty refinement object:
GoniometerRefinement with 0 geometries labeled: .
[8]:
# Let's populate the goniometer refinement object with all control point files:

ponis = [i for i in all_files if i.endswith(".poni")]
ponis.sort()
print(ponis)
for fn in ponis:
    base = os.path.splitext(fn)[0]
    fimg = fabio.open(base + ".cbf")
    gonioref.new_geometry(os.path.basename(base), image=fimg.data, metadata=fimg.header, control_points=base+".npt",
                          geometry=fn, calibrant=CeO2)

print("Filled refinement object:")
print(gonioref)
print(os.linesep+"\tLabel \t Distance")
for k, v in gonioref.single_geometries.items():
    print(k,v.get_position())
['/tmp/pyFAI_testdata_kieffer/MX_ceria.tar.bz2__content/MX_ceria/ceria_150_1_0001.poni', '/tmp/pyFAI_testdata_kieffer/MX_ceria.tar.bz2__content/MX_ceria/ceria_200_1_0001.poni', '/tmp/pyFAI_testdata_kieffer/MX_ceria.tar.bz2__content/MX_ceria/ceria_250_1_0001.poni', '/tmp/pyFAI_testdata_kieffer/MX_ceria.tar.bz2__content/MX_ceria/ceria_300_1_0001.poni', '/tmp/pyFAI_testdata_kieffer/MX_ceria.tar.bz2__content/MX_ceria/ceria_350_1_0001.poni', '/tmp/pyFAI_testdata_kieffer/MX_ceria.tar.bz2__content/MX_ceria/ceria_400_1_0001.poni', '/tmp/pyFAI_testdata_kieffer/MX_ceria.tar.bz2__content/MX_ceria/ceria_450_1_0001.poni']
Filled refinement object:
GoniometerRefinement with 7 geometries labeled: ceria_150_1_0001, ceria_200_1_0001, ceria_250_1_0001, ceria_300_1_0001, ceria_350_1_0001, ceria_400_1_0001, ceria_450_1_0001.

        Label    Distance
ceria_150_1_0001 0.15
ceria_200_1_0001 0.2
ceria_250_1_0001 0.25
ceria_300_1_0001 0.3
ceria_350_1_0001 0.35
ceria_400_1_0001 0.4
ceria_450_1_0001 0.45
[9]:
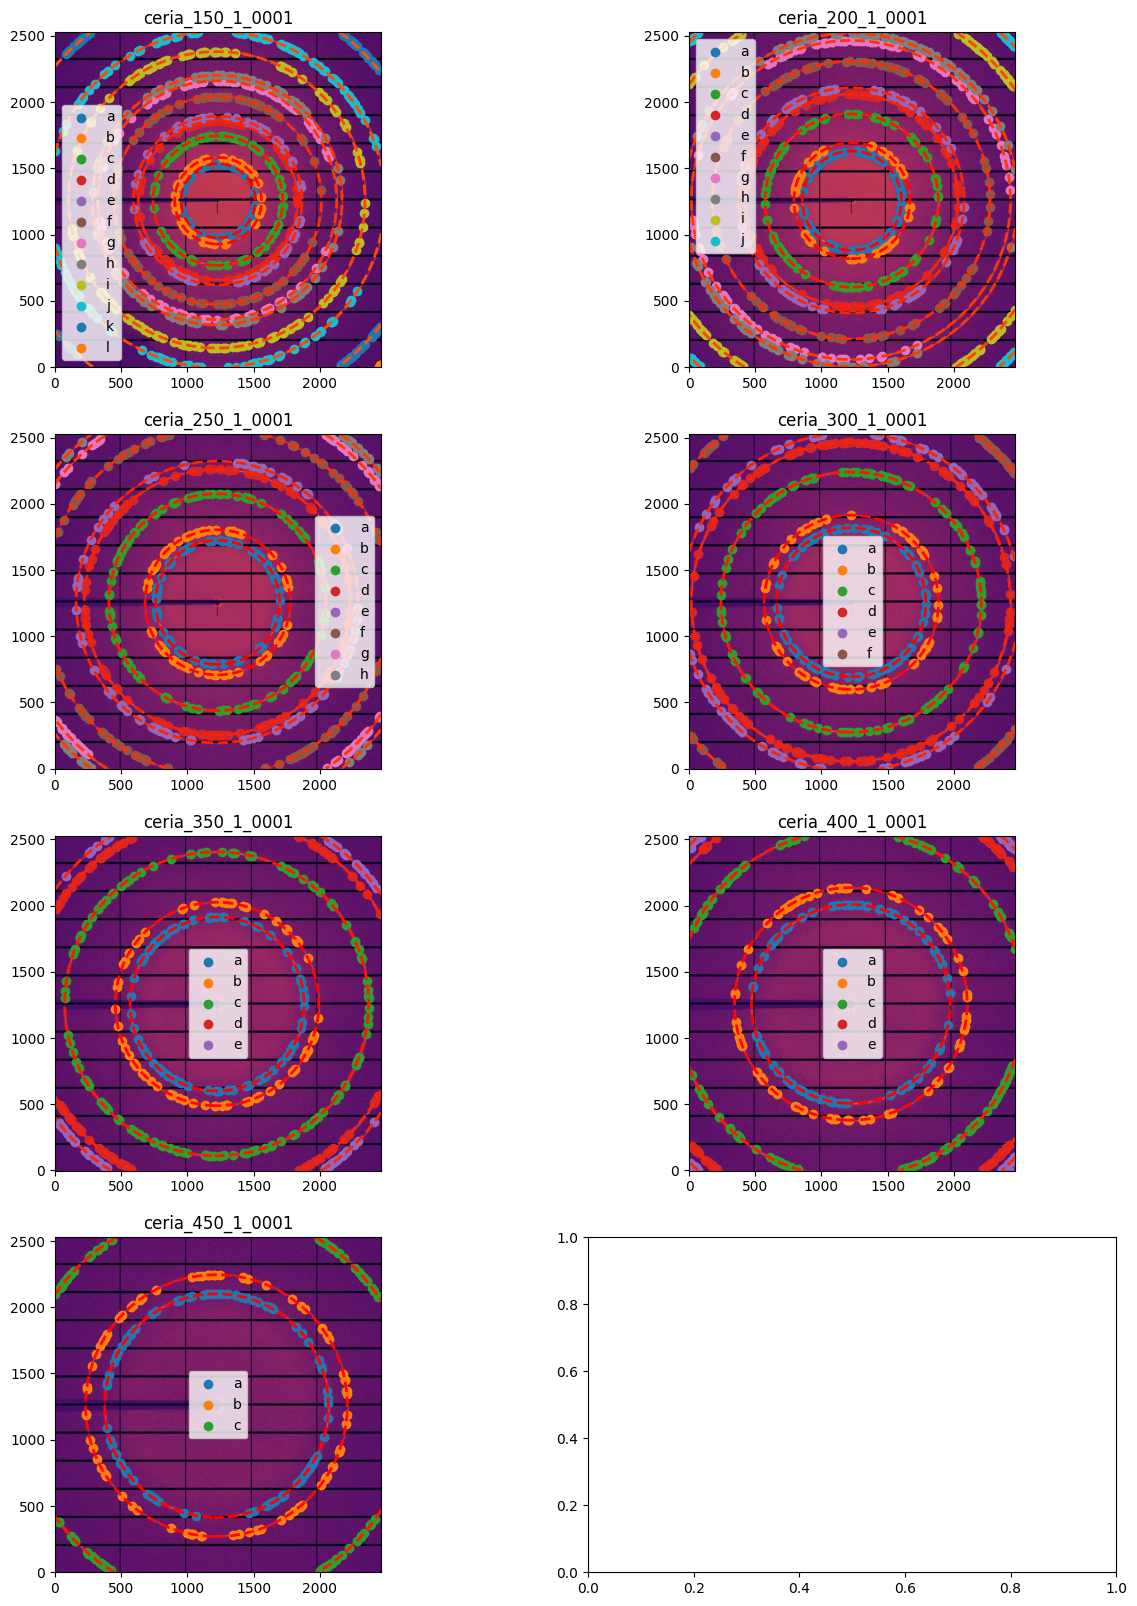
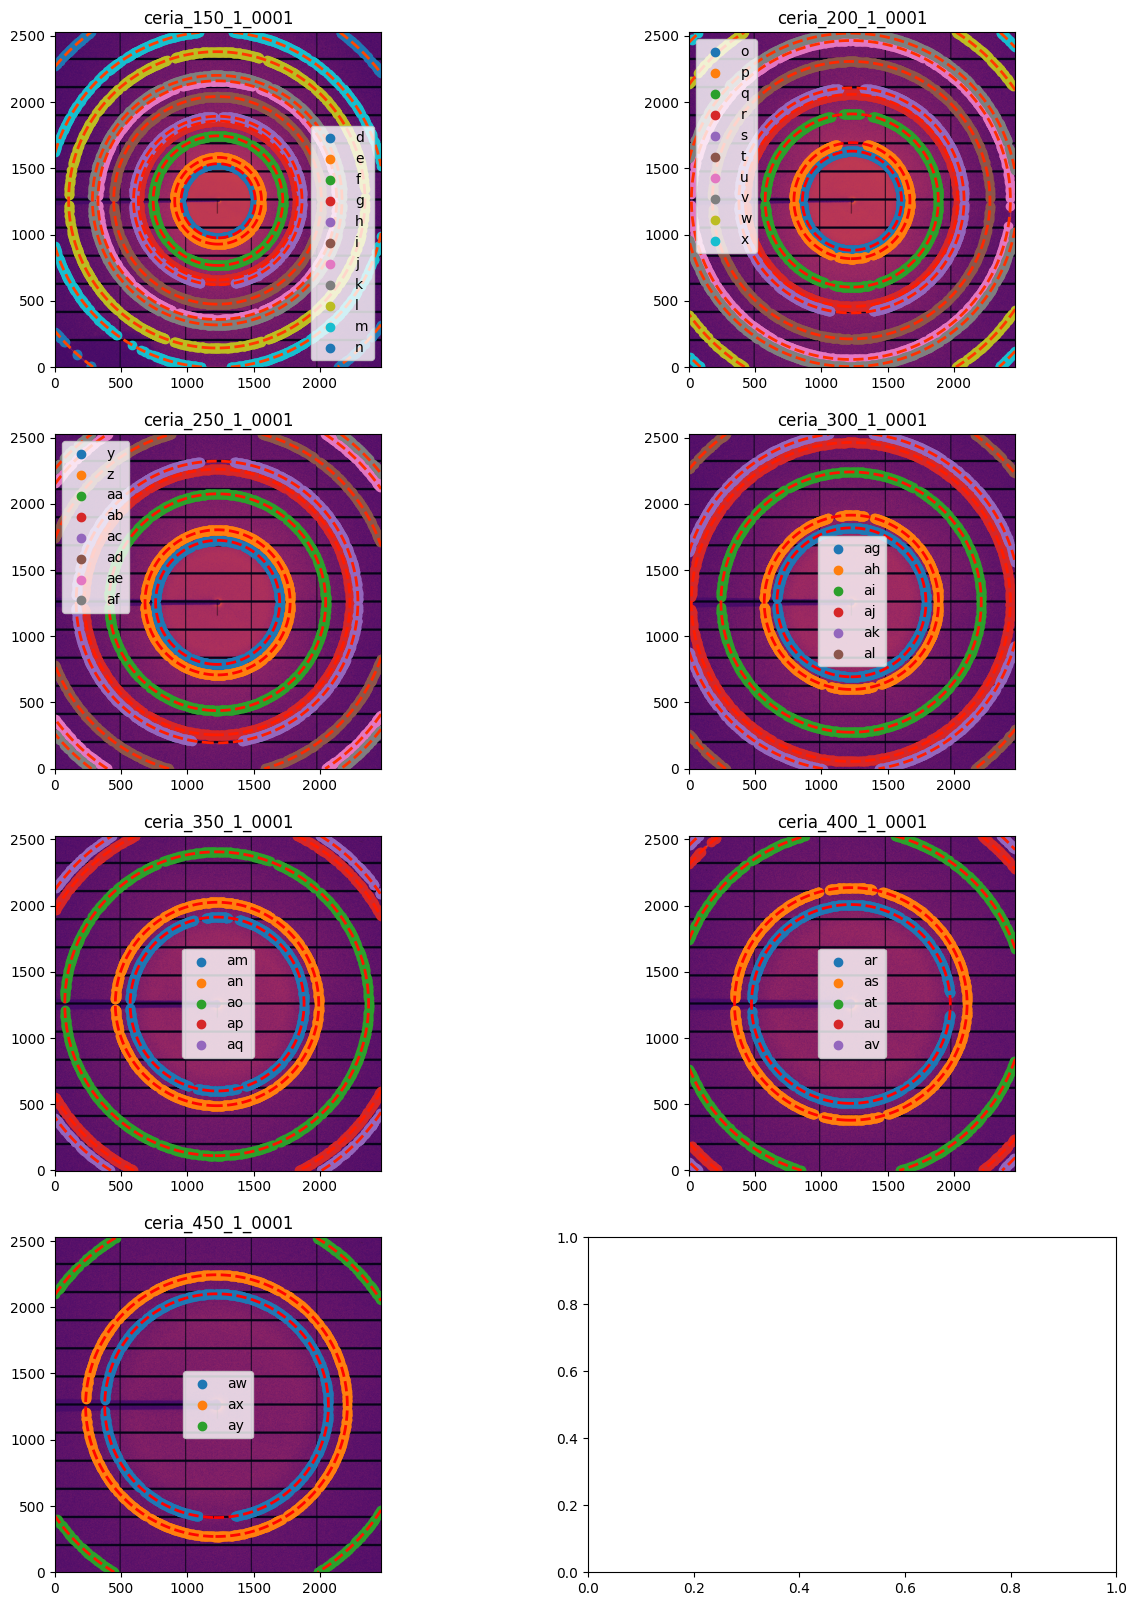
# Display all images with associated calibration:
fig, ax = subplots(4,2, figsize=(15, 20))

for idx, sg in enumerate(gonioref.single_geometries.values()):
    jupyter.display(sg=sg, ax=ax[idx//2,idx%2])
[10]:
# Initial refinement of the translation table model

gonioref.refine3()
Free parameters: ['dist_offset', 'dist_scale', 'poni1', 'poni2', 'rot1', 'rot2']
Fixed: {}
 message: Optimization terminated successfully
 success: True
  status: 0
     fun: 5.119380332307766e-07
       x: [-1.188e-03  1.002e+00  2.155e-01  2.131e-01  6.612e-03
            2.803e-03]
     nit: 18
     jac: [ 1.154e-06  3.422e-07  8.122e-08  5.030e-08 -7.173e-08
           -1.114e-07]
    nfev: 130
    njev: 18
Constrained Least square 0.0016696847686478021 --> 5.119380332307766e-07
maxdelta on poni1: 0.2 --> 0.21548513632434602
[10]:
np.float64(5.119380332307766e-07)
[11]:
# Save the result of the fitting to a file and display the content of the JSON file:

gonioref.save("ID29.json")
with open("ID29.json") as fd:
    print(fd.read())
{
  "content": "Goniometer calibration v2",
  "detector": "Pilatus 6M",
  "detector_config": {
    "orientation": 3
  },
  "wavelength": 9.72386e-11,
  "param": [
    -0.0011879346148879102,
    1.001904706904089,
    0.21548513632434602,
    0.2130990512982539,
    0.006612408557536195,
    0.0028032884831129296
  ],
  "param_names": [
    "dist_offset",
    "dist_scale",
    "poni1",
    "poni2",
    "rot1",
    "rot2"
  ],
  "pos_names": [
    "pos"
  ],
  "trans_function": {
    "content": "GeometryTransformation",
    "param_names": [
      "dist_offset",
      "dist_scale",
      "poni1",
      "poni2",
      "rot1",
      "rot2"
    ],
    "pos_names": [
      "pos"
    ],
    "dist_expr": "pos * dist_scale + dist_offset",
    "poni1_expr": "poni1",
    "poni2_expr": "poni2",
    "rot1_expr": "rot1",
    "rot2_expr": "rot2",
    "rot3_expr": "0.0",
    "constants": {
      "pi": 3.141592653589793
    }
  }
}
[12]:
# Restore the translation table setting from the file

transtable = Goniometer.sload("ID29.json")
print("Translation table: \n",transtable)
Translation table:
 Goniometer with param GonioParam(dist_offset=-0.0011879346148879102, dist_scale=1.001904706904089, poni1=0.21548513632434602, poni2=0.2130990512982539, rot1=0.006612408557536195, rot2=0.0028032884831129296)
 with Detector Pilatus 6M        PixelSize= 172µm, 172µm         BottomRight (3)
[13]:
# Create a multi-geometry object for all images in this set:

distances = [get_distance(fabio.open(fn).header) for fn in image_files]
print("Distances: ", distances)
multigeo = transtable.get_mg(distances)
multigeo.radial_range=(0, 65)
print(multigeo)
Distances:  [0.15, 0.2, 0.25, 0.3, 0.35, 0.4, 0.45]
MultiGeometry integrator with 7 geometries on (0, 65) radial range ((2th_deg, chi_deg)) and (-180, 180) azimuthal range (deg)
[14]:
# Integrate the set of images in a single run:

res = multigeo.integrate1d([fabio.open(fn).data for fn in image_files], 10000)

# Display the result using matplotlib
fig, ax = subplots()
ax.plot(*res)
ax.set_xlabel(res.unit.label)
ax.set_ylabel("Intensity")
ax.set_xlim(17, 22)
ax.set_title("Zoom on the two first rings")
pass
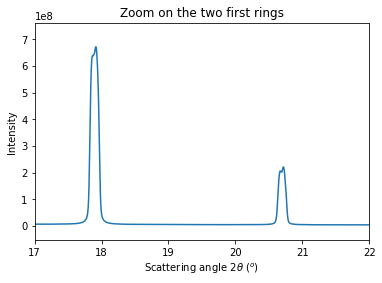
Accoring to the provious image, peaks look double which indicates a bad modeling of the setup or a bad fitting. As the fitting ended successfully, the bug is likely in the model: let’s allow the PONI to move with the distance
[15]:
# Let's refine poni1 and poni2 also as function of the distance:

geotrans2 = GeometryTransformation(param_names = ["dist_offset", "dist_scale",
                                                  "poni1_offset", "poni1_scale",
                                                  "poni2_offset", "poni2_scale",
                                                  "rot1","rot2"],
                         dist_expr="pos * dist_scale + dist_offset",
                         poni1_expr="pos * poni1_scale + poni1_offset",
                         poni2_expr="pos * poni2_scale + poni2_offset",
                         rot1_expr="rot1",
                         rot2_expr="rot2",
                         rot3_expr="0.0")

#initial guess from former parameter set
param2 = (gonioref.nt_param(*gonioref.param))._asdict()
param2["poni1_offset"] = 0
param2["poni2_offset"] = 0
param2["poni1_scale"] = 1
param2["poni2_scale"] = 1

gonioref2 = GoniometerRefinement(param2,
                                 pos_function = get_distance,
                                 trans_function=geotrans2,
                                 detector=pilatus,
                                 wavelength=wavelength)
gonioref2.single_geometries = gonioref.single_geometries.copy()
print(gonioref2)
GoniometerRefinement with 7 geometries labeled: ceria_150_1_0001, ceria_200_1_0001, ceria_250_1_0001, ceria_300_1_0001, ceria_350_1_0001, ceria_400_1_0001, ceria_450_1_0001.
[16]:
# Refinement of the second model with all distances free

gonioref2.refine2()
Cost function before refinement: 0.043644874204164075
[-0.00118793  1.00190471  0.          1.          0.          1.
  0.00661241  0.00280329]
 message: Optimization terminated successfully
 success: True
  status: 0
     fun: 1.6219985734081495e-07
       x: [-1.187e-03  1.002e+00  2.157e-01 -4.297e-03  2.130e-01
            1.381e-03  7.352e-03  4.921e-03]
     nit: 34
     jac: [ 5.322e-07  8.743e-08  1.655e-07  1.802e-08 -2.930e-07
           -7.383e-08  8.450e-08 -1.736e-08]
    nfev: 310
    njev: 34
Cost function after refinement: 1.6219985734081495e-07
GonioParam(dist_offset=np.float64(-0.0011868649105581442), dist_scale=np.float64(1.0018428737012415), poni1_offset=np.float64(0.21574533062987972), poni1_scale=np.float64(-0.004296673893495674), poni2_offset=np.float64(0.2130099341371724), poni2_scale=np.float64(0.0013809412093970974), rot1=np.float64(0.0073518675555818485), rot2=np.float64(0.00492120664670372))
maxdelta on: poni1_scale (3) 1 --> -0.004296673893495674
[16]:
array([-0.00118686,  1.00184287,  0.21574533, -0.00429667,  0.21300993,
        0.00138094,  0.00735187,  0.00492121])
[17]:
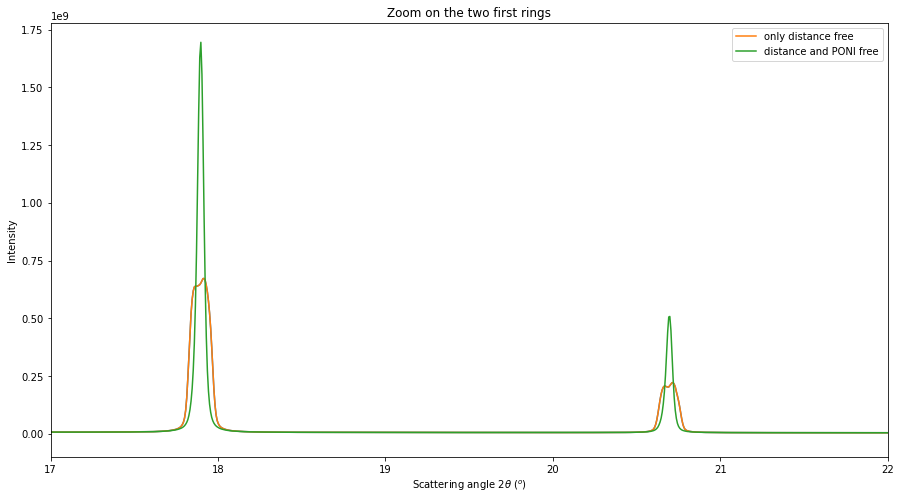
# Integration of all images with the second model

multigeo2 = gonioref2.get_mg(distances)
multigeo2.radial_range=(0, 65)
print(multigeo2)
res2 = multigeo2.integrate1d([fabio.open(fn).data for fn in image_files], 10000)

# Display the result, zooming on the two first rings
fig, ax = subplots(figsize=(15,8))
ax.plot(*res)
ax.plot(*res, label="only distance free")
ax.plot(*res2, label="distance and PONI free")
ax.set_ylabel("Intensity")
ax.set_xlim(17, 22)
ax.set_title("Zoom on the two first rings")
ax.set_xlabel(res2.unit.label)
ax.legend()
pass
MultiGeometry integrator with 7 geometries on (0, 65) radial range ((2th_deg, chi_deg)) and (-180, 180) azimuthal range (deg)
[18]:
# Re-extract many more control points from images for a better fit

fig, ax = subplots(4,2, figsize=(15, 20))

for idx, sg in enumerate(gonioref2.single_geometries.values()):
    sg.extract_cp(pts_per_deg=3)
    jupyter.display(sg=sg, ax=ax[idx//2, idx%2])
[19]:
# Refine again the model

gonioref2.refine2()

# Build the MultiGeometry integrator object

multigeo3 = gonioref2.get_mg(distances)
multigeo3.radial_range=(0, 65)
print(multigeo3)

# Perform the azimuthal integration
res3 = multigeo3.integrate1d([fabio.open(fn).data for fn in image_files], 10000)

# Display the result
fig, ax = subplots(figsize=(15,8))
ax.plot(*res, label="only distance free")
ax.plot(*res2, label="distance and PONI free")
ax.plot(*res2, linestyle="--", label="distance and PONI free, more points")
ax.set_xlabel(res2.unit.label)
ax.set_xlim(17, 22)
ax.legend()
pass
Cost function before refinement: 5.392113117548659e-08
[-0.00118686  1.00184287  0.21574533 -0.00429667  0.21300993  0.00138094
  0.00735187  0.00492121]
 message: Optimization terminated successfully
 success: True
  status: 0
     fun: 5.0104765147659725e-08
       x: [-1.209e-03  1.002e+00  2.157e-01 -4.105e-03  2.130e-01
            1.254e-03  7.272e-03  4.808e-03]
     nit: 11
     jac: [-6.825e-08 -7.794e-08  7.180e-08 -6.557e-08 -1.048e-06
           -1.262e-08  7.585e-07 -4.947e-07]
    nfev: 102
    njev: 11
Cost function after refinement: 5.0104765147659725e-08
GonioParam(dist_offset=np.float64(-0.0012085991407975265), dist_scale=np.float64(1.0018261568176898), poni1_offset=np.float64(0.21574394347702383), poni1_scale=np.float64(-0.004105408572885025), poni2_offset=np.float64(0.21301462528030377), poni2_scale=np.float64(0.001254432818940937), rot1=np.float64(0.007271887563659273), rot2=np.float64(0.004808039011199493))
maxdelta on: poni1_scale (3) -0.004296673893495674 --> -0.004105408572885025
MultiGeometry integrator with 7 geometries on (0, 65) radial range ((2th_deg, chi_deg)) and (-180, 180) azimuthal range (deg)
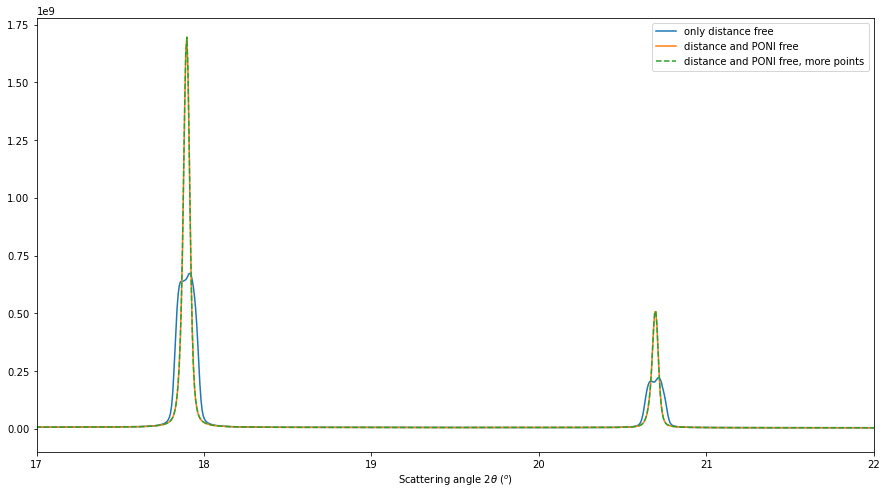
This re-extraction of control point did not help to get a sharper diffraction profile. This step was not needed.
Conclusion#
This notebook exposes the how to calibrate a translation table for a moving detector. It allows to: * Check the proper alignement of the table regarding the actual beam * Check the encoder’s precision (usually good) and offsets (arbitrary) * Perform azimuthal integration to retrieve powder diffraction patterns at any position of the detector.
[20]:
print(f"Total execution time: {time.perf_counter() - start_time:.3f} s")
Total execution time: 75.861 s