Construct a Graphical Model
A graphical model (gm) is always constructed from a sequence containing the number of labels for all the variables. The number of variables is given by the length of the sequence.
A gm can be constructed from a list in the following way:
numberOfLabels=[2,2,2,2,2]
gm=opengm.graphicalModel(numberOfLabels)
The result is a gm with 5 variables. All of them have two labels / states. The operator of the gm is an Adder (+). The operator can also be specified. The following lines will construct two graphical models, one with an Adder(+) as operator, and one with a Multiplier(*) as operator. This time a numpy.ndarray is used as number of labels sequence:
numberOfLabels=numpy.array([4,4,4] ,dtype=numpy.uint64)
gm1=opengm.graphicalModel(numberOfLabels,operator='adder')
gm2=opengm.graphicalModel(numberOfLabels,operator='multiplier')
The result will be two graphical models, each with 3 variables where each variable has four states. The operator of gm1 is an Adder(+), the operator of gm2 is an Multiplier (*)
Add Factors and Functions to a Graphical Model
Note
Variable Indices must always be sorted!
| Code | Factor Graph |
import numpy
import opengm
import matplotlib.pyplot as plt
f1=numpy.ones([2])
f2=numpy.ones([2,2])
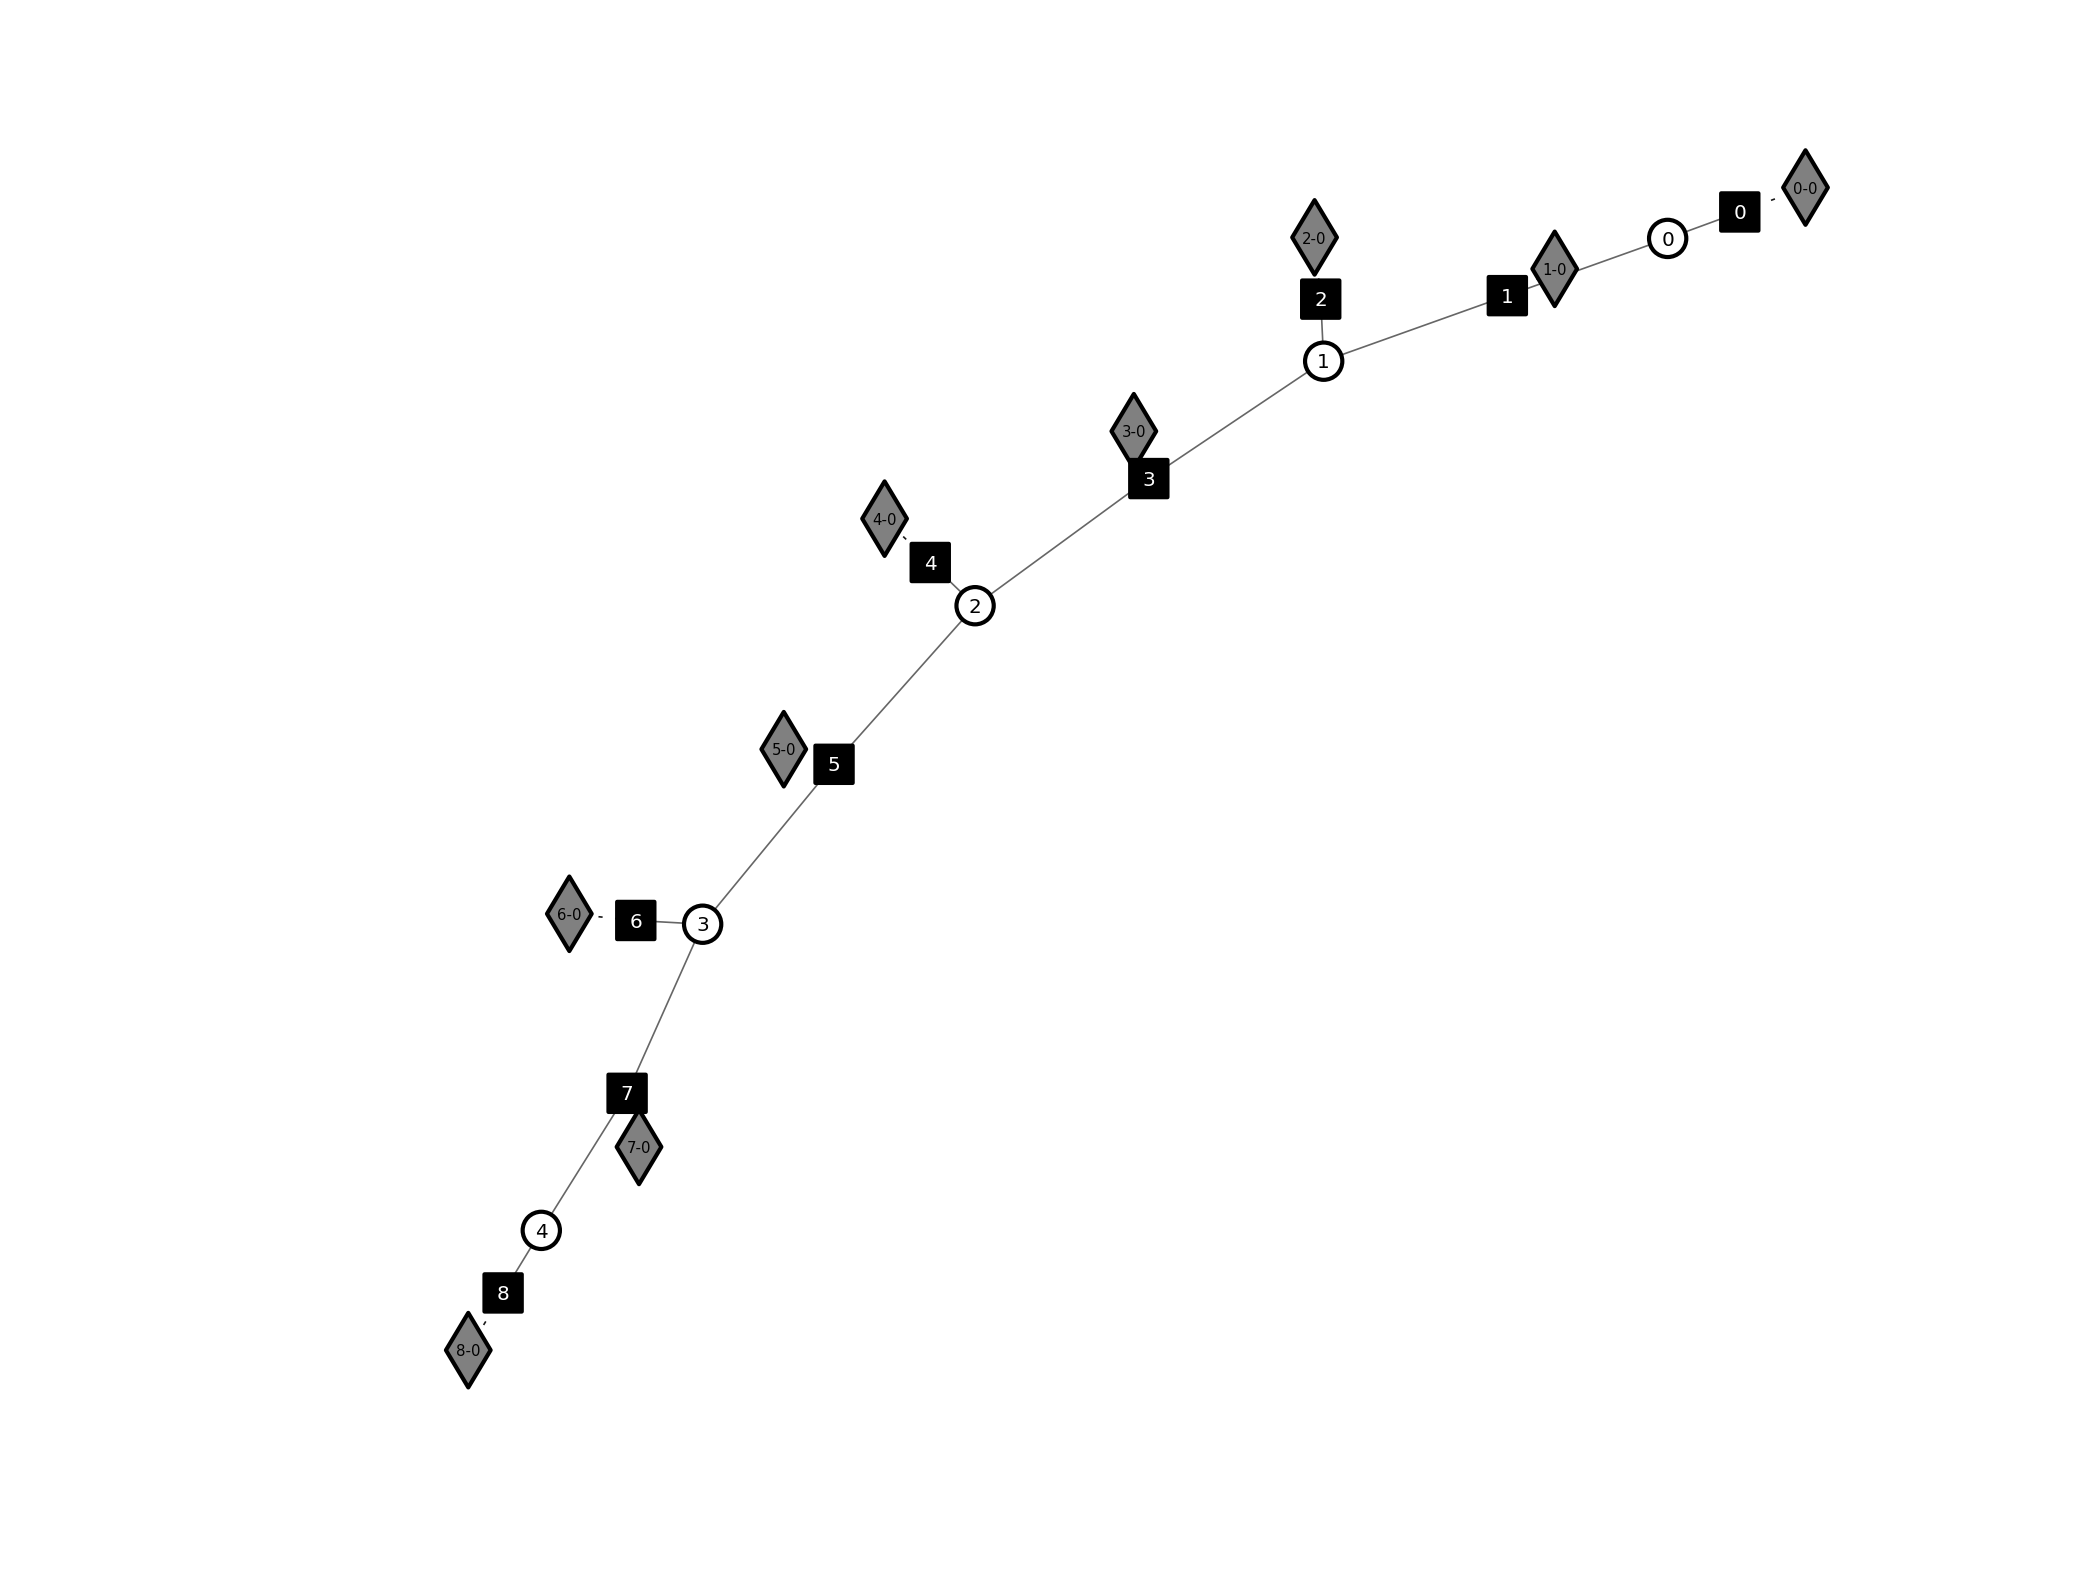
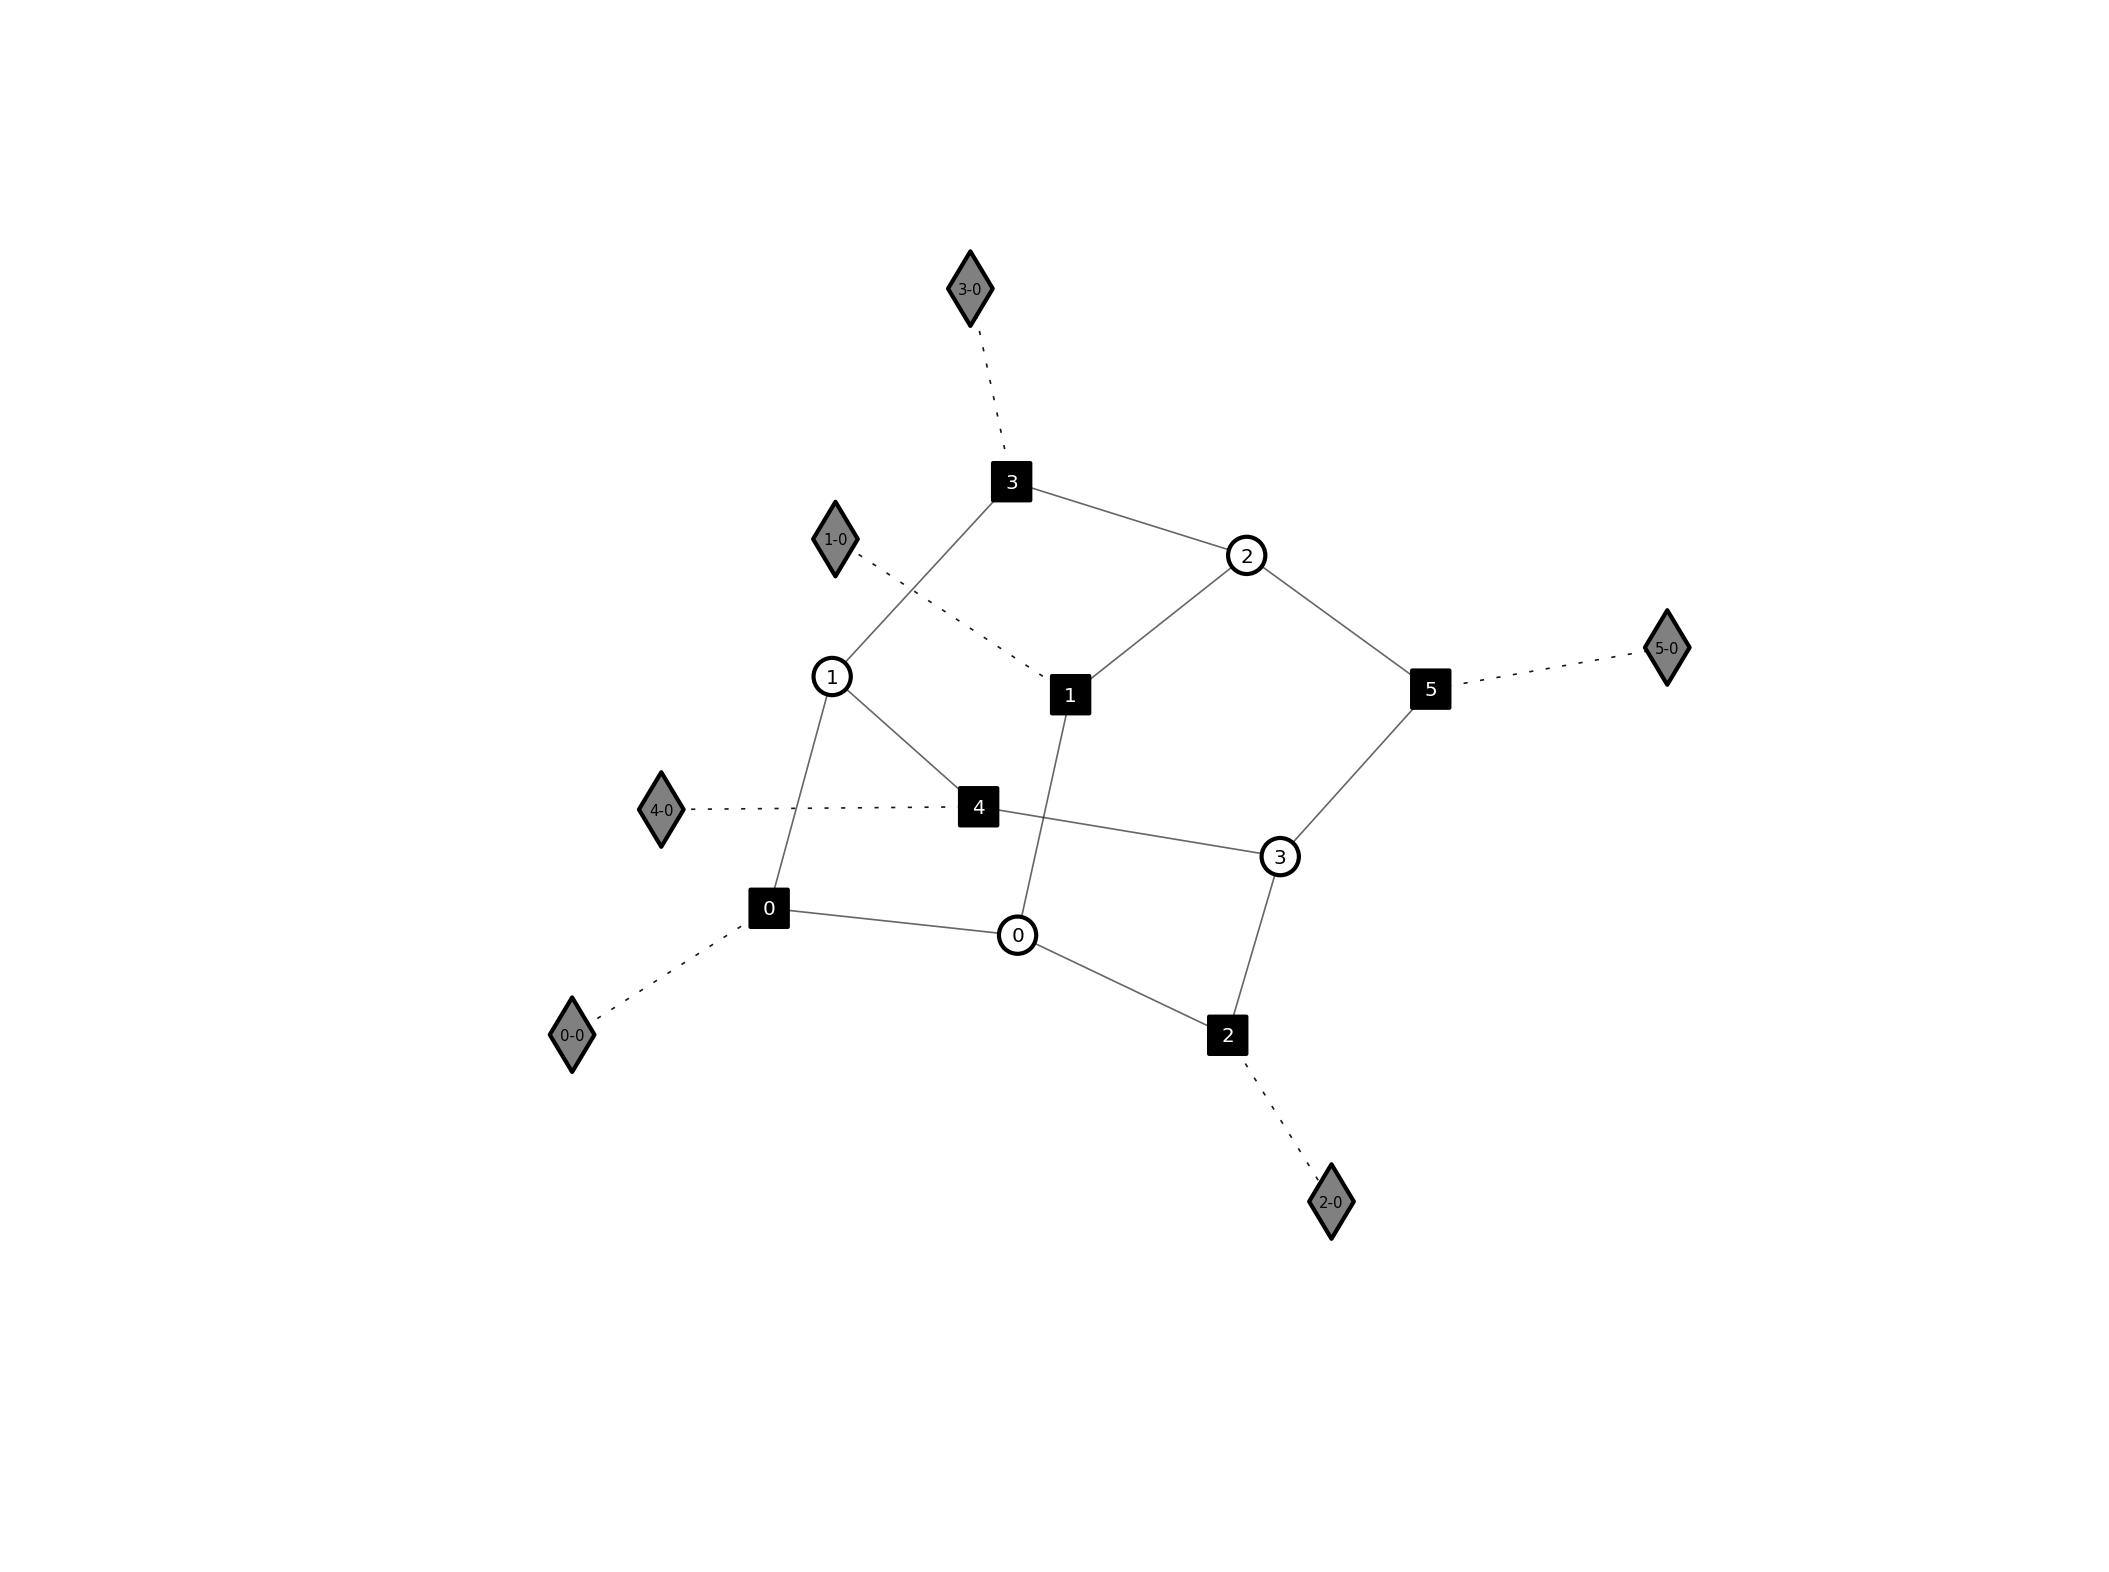
#Chain (non-shared functions):
numVar=5
gm=opengm.gm([2]*numVar)
for vi in xrange(numVar):
gm.addFactor(gm.addFunction(f1),vi)
if(vi+1<numVar):
gm.addFactor(gm.addFunction(f2),[vi,vi+1])
# visualize gm
opengm.visualizeGm( gm,show=False,layout='spring',plotFunctions=True,
plotNonShared=True,relNodeSize=0.4)
plt.savefig("chain_non_shared.png",bbox_inches='tight',dpi=300)
plt.close()
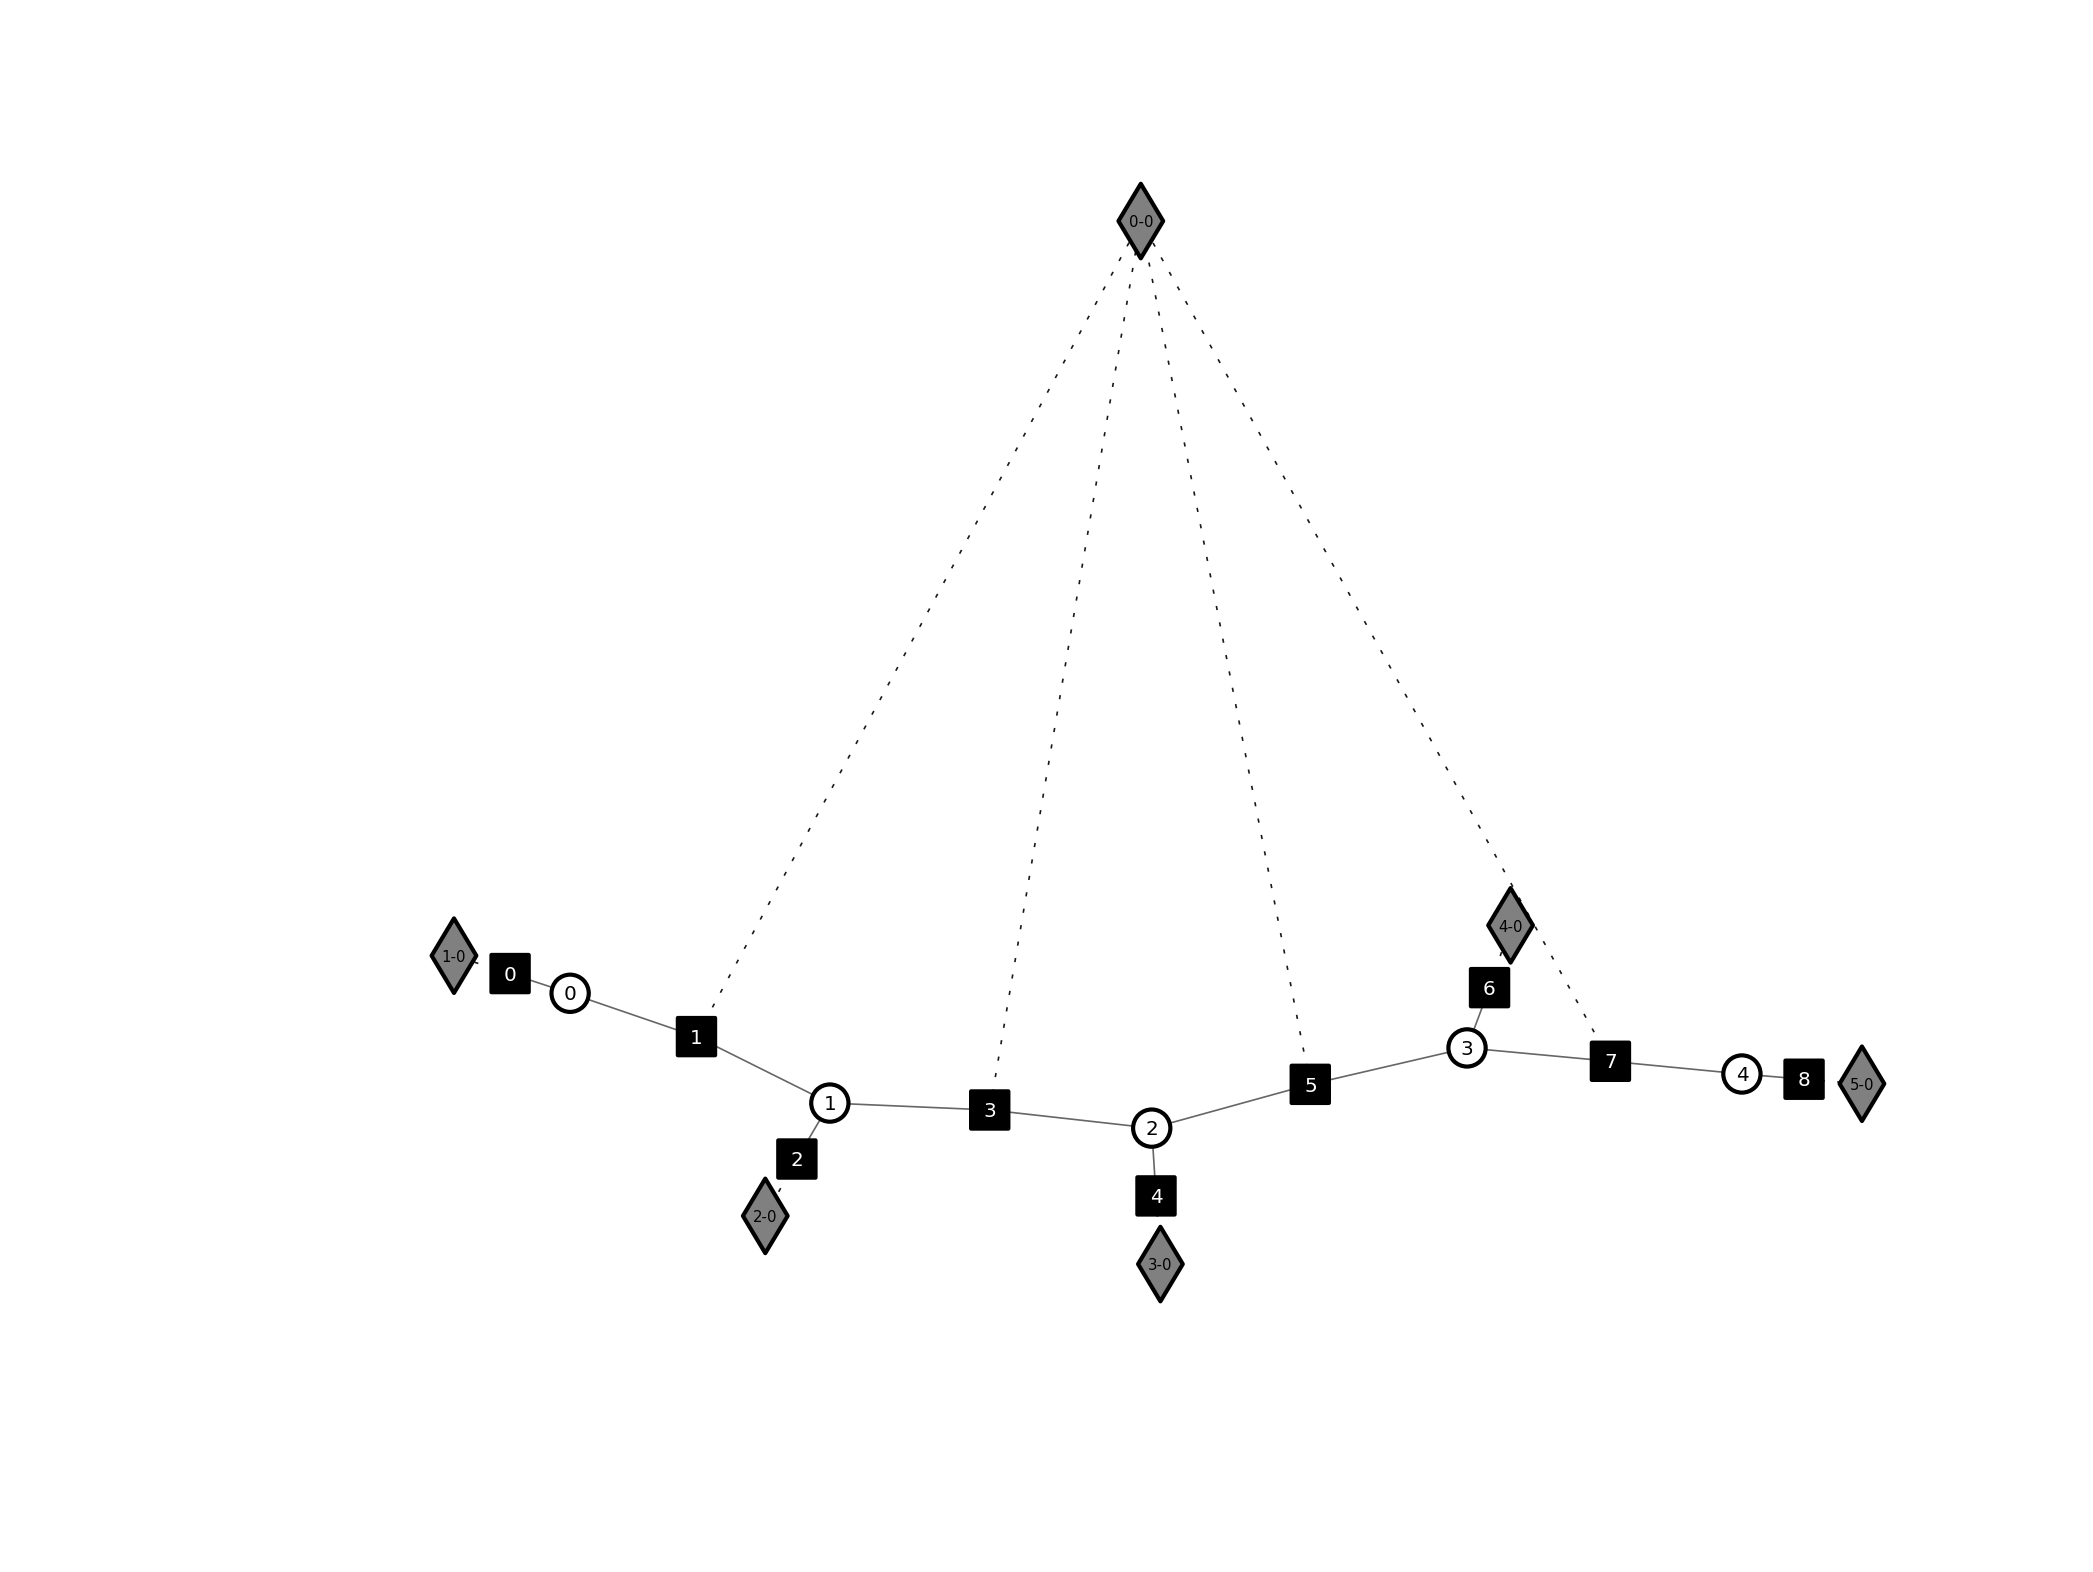
#Chain (shared high order functions):
numVar=5
gm=opengm.gm([2]*numVar)
fid2=gm.addFunction(f2)
for vi in xrange(numVar):
gm.addFactor(gm.addFunction(f1),vi)
if(vi+1<numVar):
gm.addFactor(fid2,[vi,vi+1])
# visualize gm
opengm.visualizeGm( gm,show=False,layout='spring',plotFunctions=True,
plotNonShared=True,relNodeSize=0.4)
plt.savefig("chain_shared.png",bbox_inches='tight',dpi=300)
plt.close()
|
|
import numpy
import opengm
import matplotlib.pyplot as plt
f1=numpy.ones([2])
f2=numpy.ones([2,2])
"""
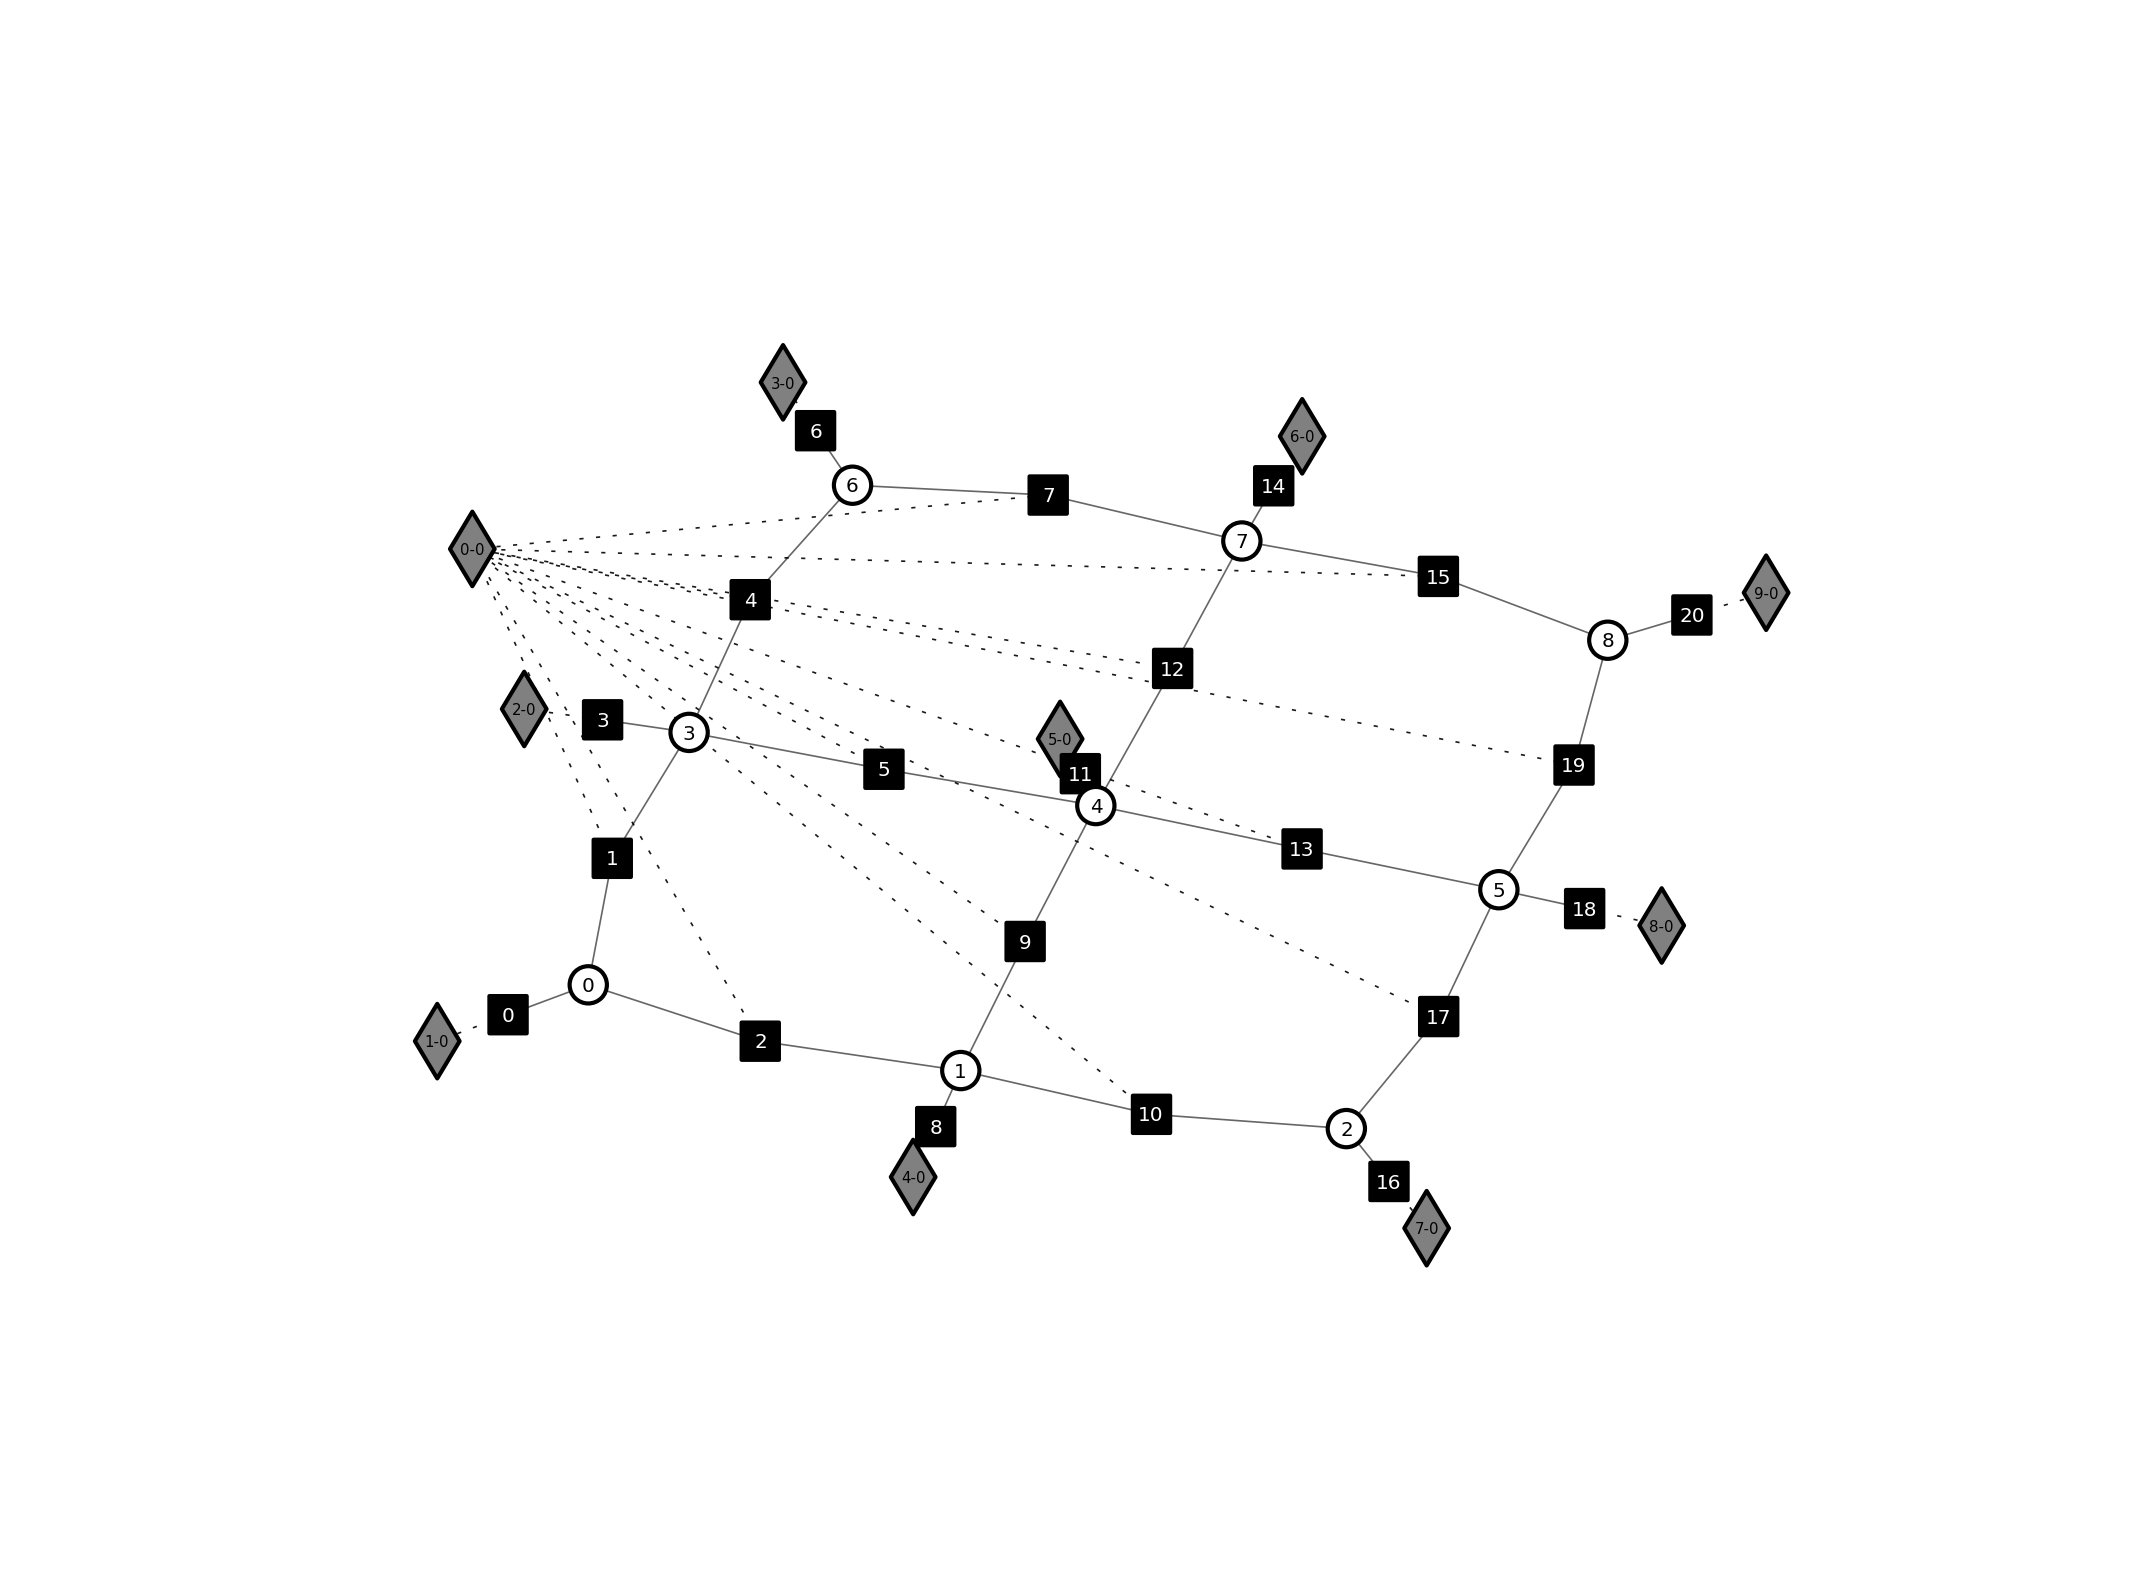
Grid:
- 4x4=16 variables
- second order factors in 4-neigbourhood
all connected to the same function
- higher order functions are shared
"""
size=3
gm=opengm.gm([2]*size*size)
fid=gm.addFunction(f2)
for y in range(size):
for x in range(size):
gm.addFactor(gm.addFunction(f1),x*size+y)
if(x+1<size):
gm.addFactor(fid,[x*size+y,(x+1)*size+y])
if(y+1<size):
gm.addFactor(fid,[x*size+y,x*size+(y+1)])
opengm.visualizeGm( gm,layout='spring',iterations=3000,
show=True,plotFunctions=True,
plotNonShared=True,relNodeSize=0.4)
plt.show
plt.savefig("grid.png",bbox_inches='tight',dpi=300)
plt.close()
|
|
import numpy
import opengm
import matplotlib.pyplot as plt

f1=numpy.ones([2])
f2=numpy.ones([2,2])
f3=numpy.ones([2,2,2])
"""
Triangle (non-shared) :
    - 3 variables
    - 3 unaries
    - 2 second order functions
    - 1 third order factor
    - functions are *non* - shared
"""
gm=opengm.gm([2,2,2])
gm.addFactor(gm.addFunction(f1),[0])
gm.addFactor(gm.addFunction(f1),[1])
gm.addFactor(gm.addFunction(f1),[2])
gm.addFactor(gm.addFunction(f2),[0,1])
gm.addFactor(gm.addFunction(f2),[1,2])
gm.addFactor(gm.addFunction(f2),[0,2])
gm.addFactor(gm.addFunction(f3),[0,1,2])

opengm.visualizeGm( gm,show=False,plotFunctions=True,
                    plotNonShared=True)
plt.savefig("triangle.png",bbox_inches='tight',
             dpi=300)
plt.close()
|
|
import numpy
import opengm
import matplotlib.pyplot as plt
f1=numpy.ones([2])
f2=numpy.ones([2,2])
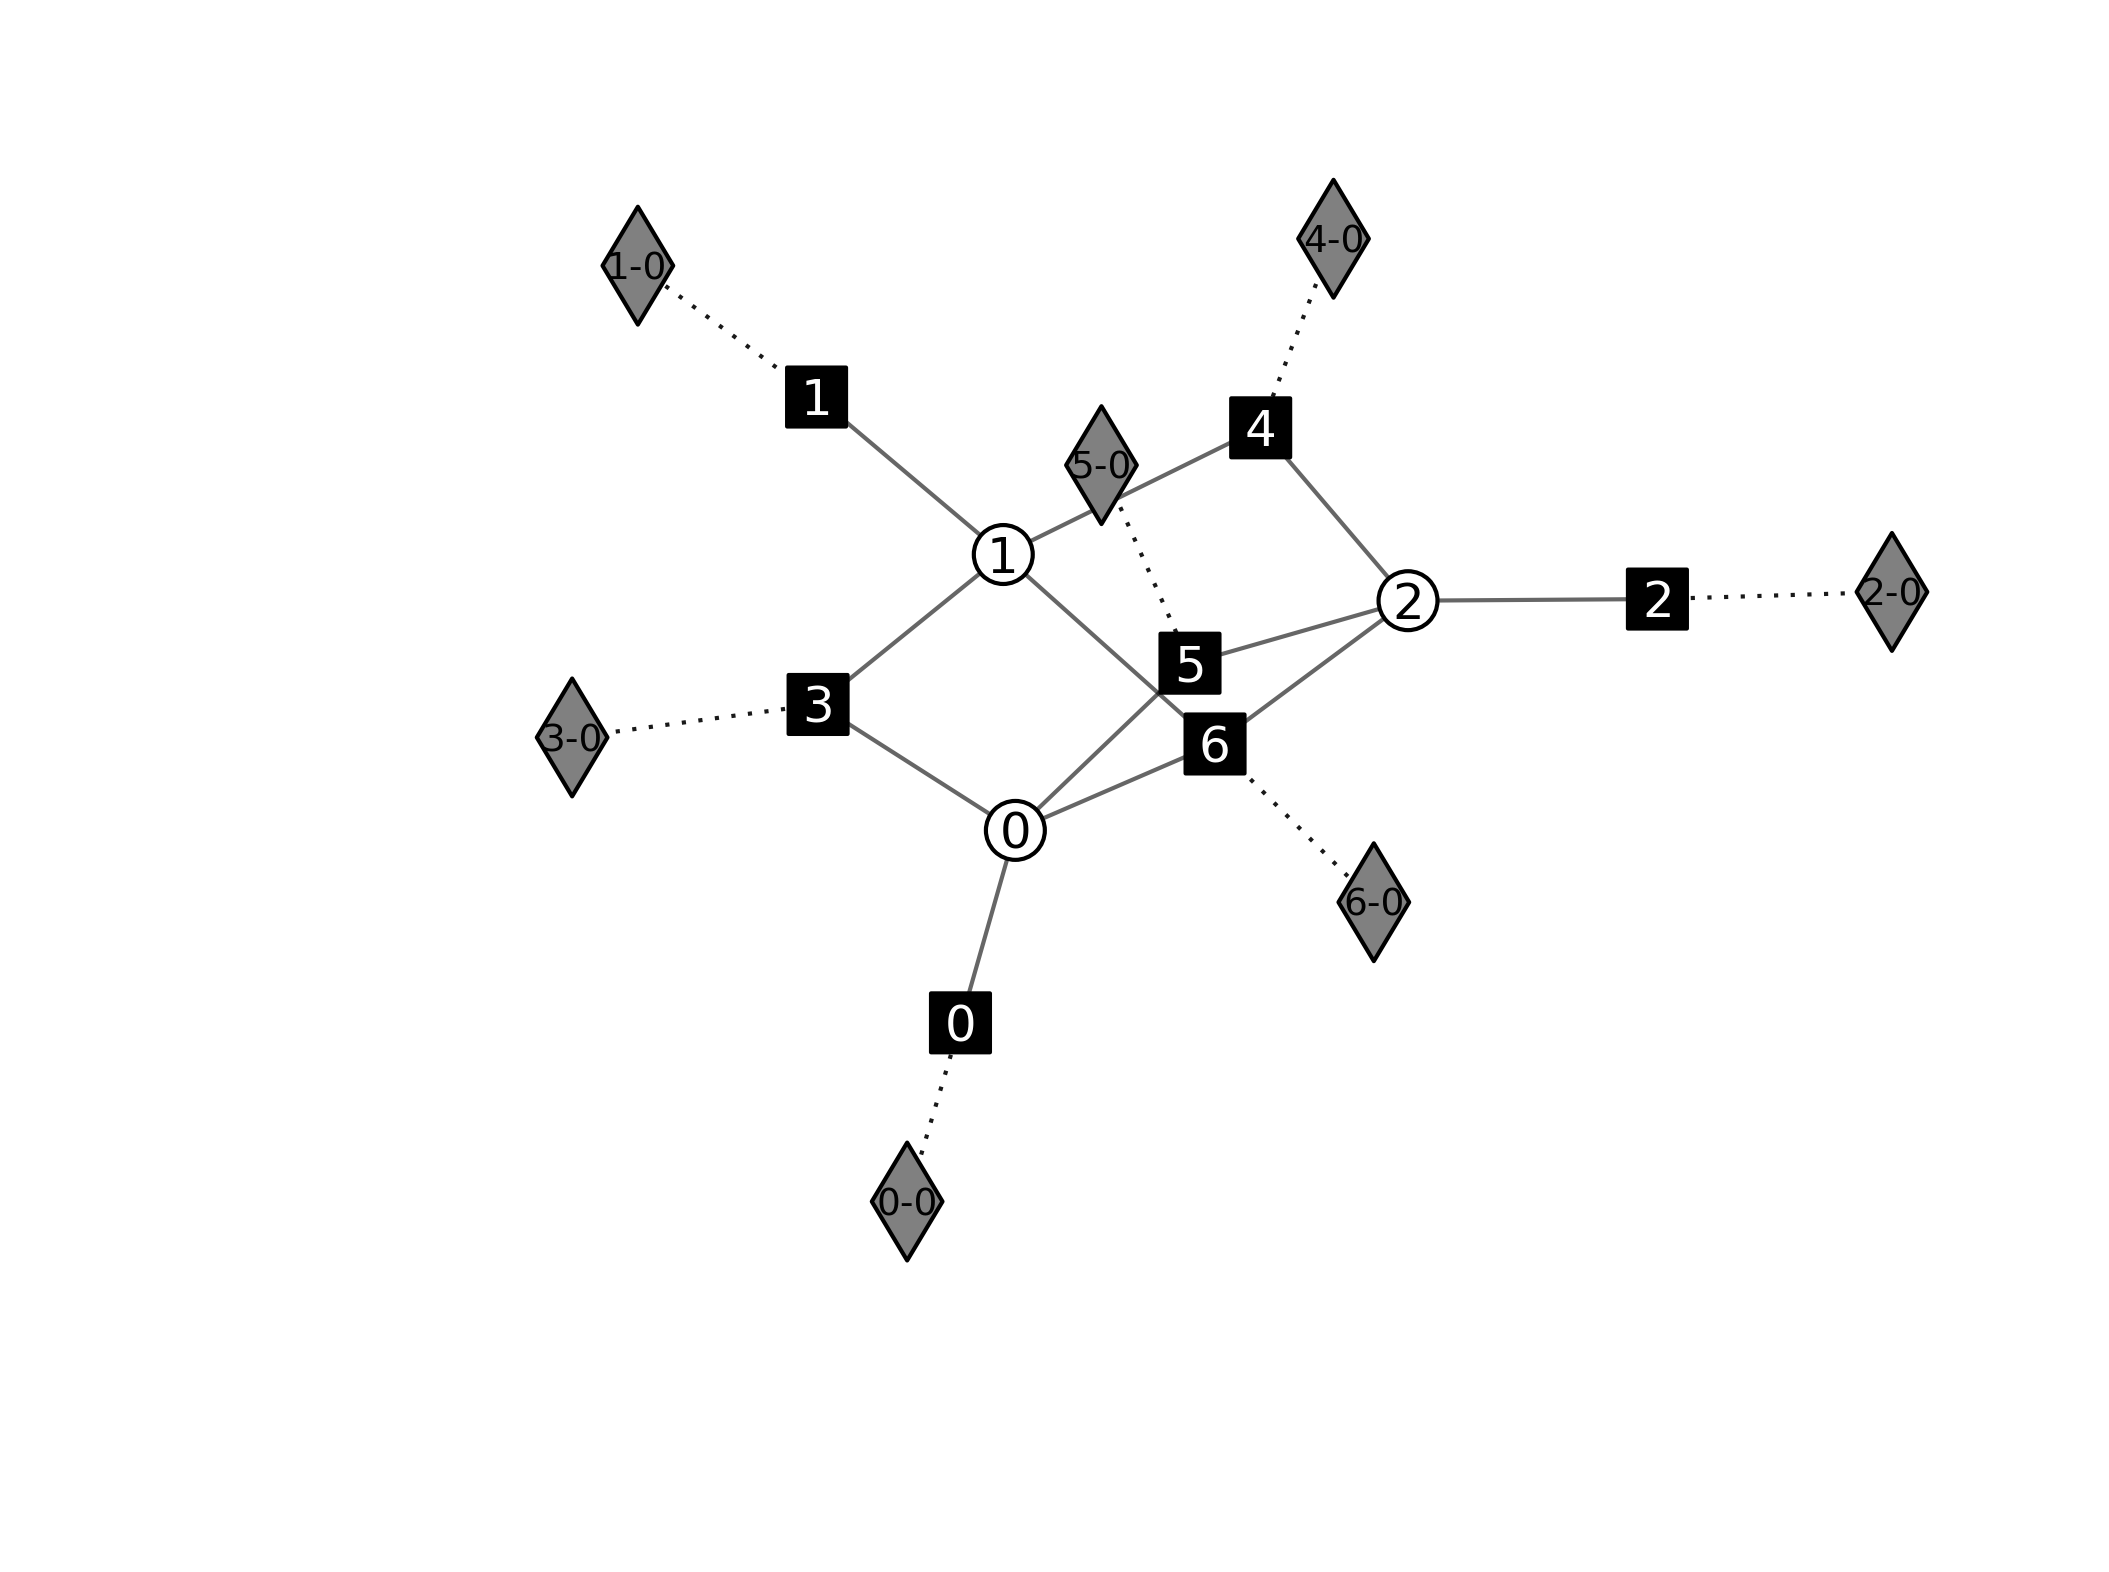
"""
Full Connected (non-shared):
- all possible pairwise connections
- functions are *non* - shared
"""
numVar=4
gm=opengm.gm([2]*numVar)
for vi0 in xrange(numVar):
for vi1 in xrange(vi0+1,numVar):
gm.addFactor(gm.addFunction(f2),[vi0,vi1])
opengm.visualizeGm( gm,show=False,layout='neato',
iterations=1000,plotFunctions=True,
plotNonShared=True,relNodeSize=0.4)
plt.savefig("full_non_shared.png",bbox_inches='tight',dpi=300)
plt.close()
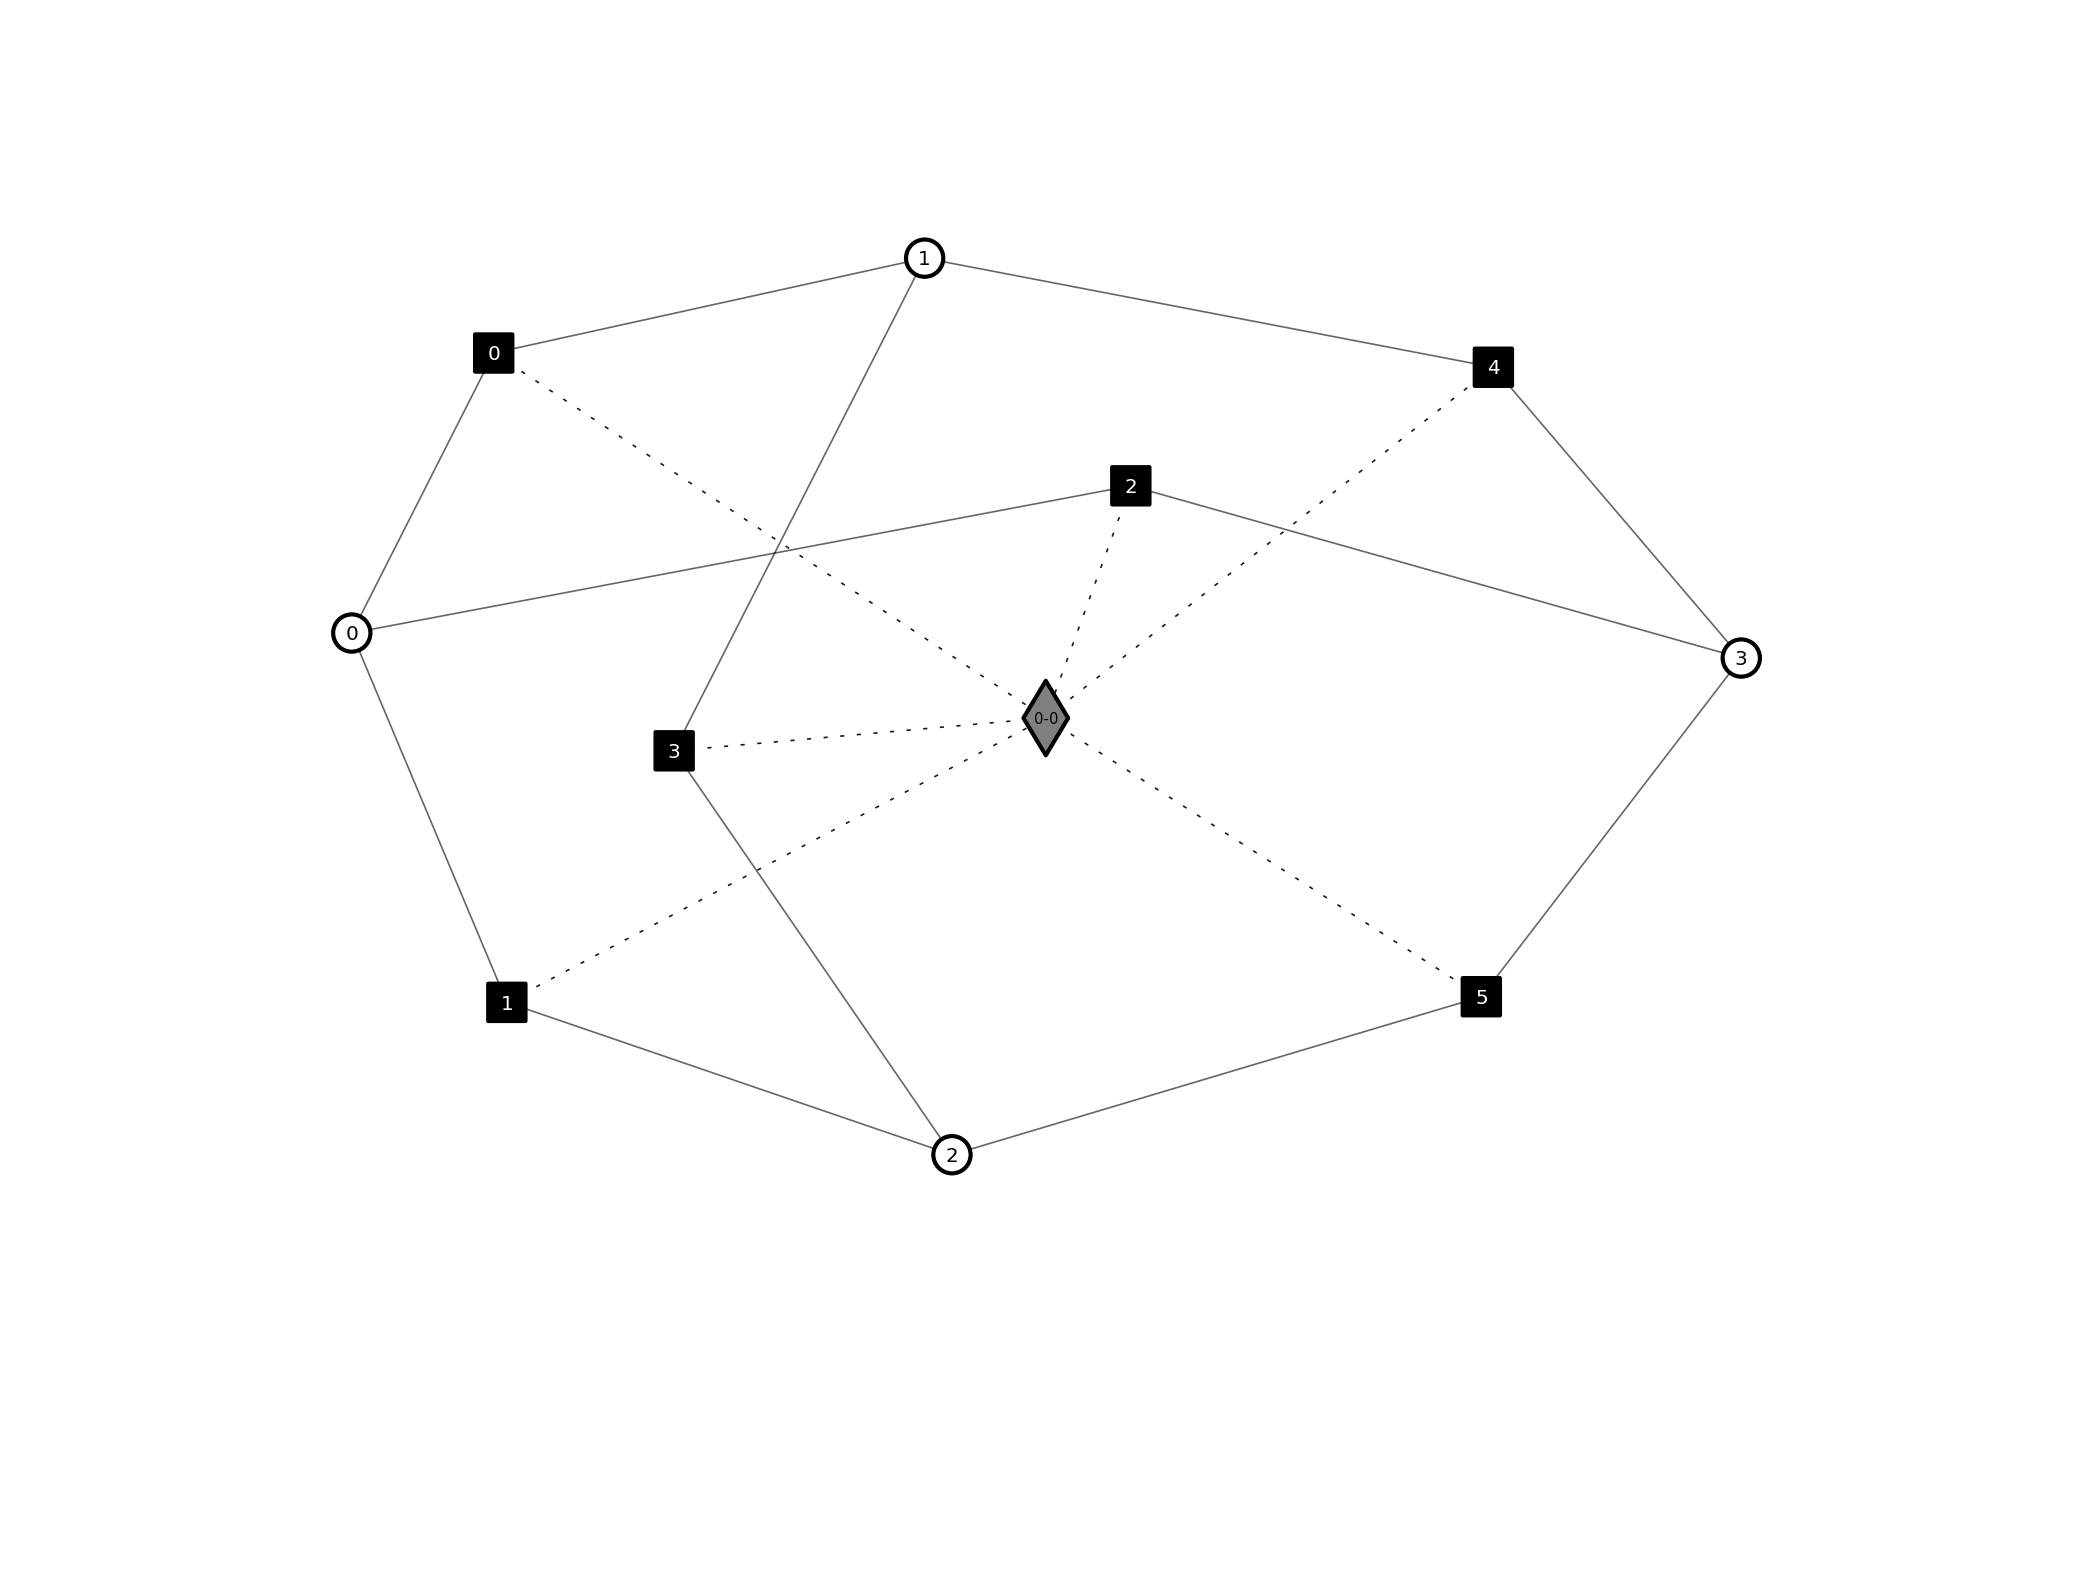
"""
Full Connected (shared):
- 5 variables
- 10 second order factors
(all possible pairwise connections)
- functions are *non* - shared
"""
numVar=4
gm=opengm.gm([2]*numVar)
fid2=gm.addFunction(f2)
for vi0 in xrange(numVar):
for vi1 in xrange(vi0+1,numVar):
gm.addFactor(fid2,[vi0,vi1])
opengm.visualizeGm( gm,show=False,layout='neato',
iterations=1000,plotFunctions=True,
plotNonShared=True,relNodeSize=0.4)
plt.savefig("full_shared.png",bbox_inches='tight',dpi=300)
plt.close()
|
|
Add Functions to a Graphical Model
import opengm
import numpy

gm=opengm.gm([2,2,3,3,4,4,4],operator='adder')
functionIds=[]

#---------------------------------------------------------------
# Numpy Ndarray
# (is stored in a different multi array function within opengm)
#---------------------------------------------------------------

f=numpy.random.rand(2,2,3,4)
fid=gm.addFunction(f)
gm.addFactor(fid,[0,1,2,4])
print "\nexplicit function: \n",f

#---------------------------------------------------------------
# Sparse Function
#---------------------------------------------------------------

# fill sparse function "by hand"
f=opengm.SparseFunction(shape=[3,4,4],defaultValue=1)
# fill diagonale with zeros
for d in xrange(4):
    f[[d,d,d]]=0
print "\nsparse function: \n",f
fid=gm.addFunction(f)
functionIds.append(fid)
gm.addFactor(fid,[3,4,5])

# fill sparse function from dense function
f=opengm.SparseFunction()
f.assignDense(numpy.identity(4),defaultValue=0)
fid=gm.addFunction(f)
functionIds.append(fid)
gm.addFactor(fid,[4,5])
print "\nsparse function: \n",f


#---------------------------------------------------------------
# Potts Function
#---------------------------------------------------------------
f=opengm.PottsFunction(shape=[2,4],valueEqual=0.0,valueNotEqual=1.0)
fid=gm.addFunction(f)
functionIds.append(fid)
gm.addFactor(fid,[0,5])
print "\npotts function: \n",f

#---------------------------------------------------------------
# Truncated Absolute Difference Function
#---------------------------------------------------------------
f=opengm.TruncatedAbsoluteDifferenceFunction(shape=[3,4],truncate=2,weight=0.2,)
fid=gm.addFunction(f)
functionIds.append(fid)
gm.addFactor(fid,[2,5])
print "\ntruncated absolute difference function: \n",f


#---------------------------------------------------------------
# Truncated  Squared Difference Function
#---------------------------------------------------------------
f=opengm.TruncatedSquaredDifferenceFunction(shape=[3,4],truncate=2,weight=2.0)
fid=gm.addFunction(f)
functionIds.append(fid)
gm.addFactor(fid,[2,5])
print "\ntruncated  squared difference function: \n",f

for factor,factorIndex in gm.factorsAndIds():
    print "\ngm[",factorIndex,"] : ",factor
    print "Value Table: \n",numpy.array(factor)
Add Multiple Factors and Functions to a Graphical Model at once
import opengm
import numpy

#------------------------------------------------------------------------------------
# This example shows how multiple  unaries functions and functions / factors add once
#------------------------------------------------------------------------------------
# add unaries from a for a 2d grid / image
width=10
height=20
numVar=width*height
numLabels=2
# construct gm
gm=opengm.gm(numpy.ones(numVar,dtype=opengm.index_type)*numLabels)
# construct an array with all unaries (random in this example)
unaries=numpy.random.rand(width,height,numLabels)
# reshape unaries is such way, that the first axis is for the different functions
unaries2d=unaries.reshape([numVar,numLabels])
# add all unary functions at once (#numVar unaries)
fids=gm.addFunctions(unaries2d)
# numpy array with the variable indices for all factors
vis=numpy.arange(0,numVar,dtype=numpy.uint64)
# add all unary factors at once
gm.addFactors(fids,vis)
Save and Load a Graphical Model
Save a gm:
opengm.hdf5.saveGraphicalModel(gm,'path','dataset')
Load a gm:
opengm.hdf5.loadGraphicalModel(gm,'path','dataset')