Markov Chain
This example builds a Markov Chain
Code
import opengm
import numpy

chainLength=5
numLabels=100
numberOfStates=numpy.ones(chainLength,dtype=opengm.label_type)*numLabels
gm=opengm.gm(numberOfStates,operator='adder')
#add some random unaries
for vi in range(chainLength):
   unaryFuction=numpy.random.random(numLabels)
   gm.addFactor(gm.addFunction(unaryFuction),[vi])
#add one 2.order function


f=opengm.differenceFunction(shape=[numLabels]*2,weight=0.1)
print type(f),f
fid=gm.addFunction(f)
#add factors on a chain
for vi in range(chainLength-1):
   gm.addFactor(fid,[vi,vi+1])


inf = opengm.inference.BeliefPropagation(gm,parameter=opengm.InfParam(steps=40,convergenceBound=0 ,damping=0.9))
inf.infer(inf.verboseVisitor())


print inf.arg()
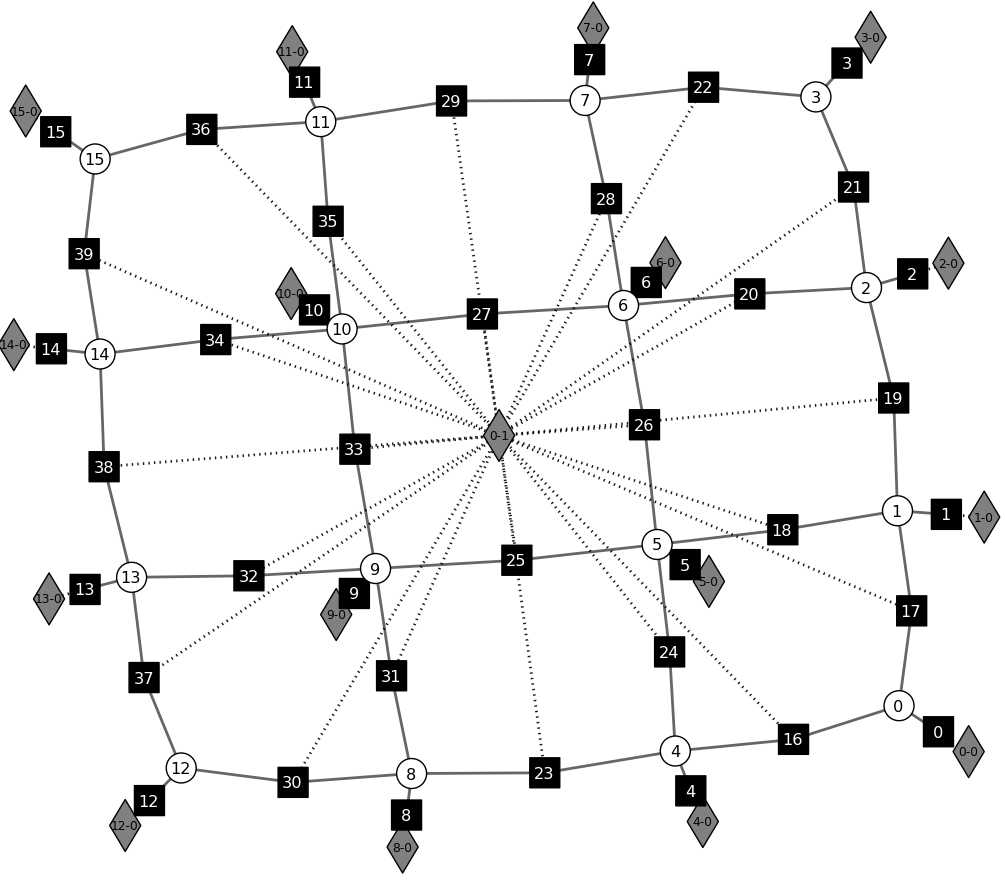
Extended Factor Graph
An auto-generated [1] graph [2] for this graphical model.
See also
opengm.visualizeGm() opengm.__init__.grid2d2Order() opengm.grid2d2Order()
Potts Model
This example builds a Potts model on a two dimensional grid
Code
import numpy
import opengm


img=numpy.random.rand(4,4)
dimx=img.shape[0]
dimy=img.shape[1]

numVar=dimx*dimy
numLabels=2
beta=0.3

numberOfStates=numpy.ones(numVar,dtype=opengm.index_type)*numLabels
gm=opengm.graphicalModel(numberOfStates,operator='adder')


#Adding unary function and factors
for y in range(dimy):
   for x in range(dimx):
      f=numpy.ones(2,dtype=numpy.float32)
      f[0]=img[x,y]
      f[1]=1.0-img[x,y]
      fid=gm.addFunction(f)
      gm.addFactor(fid,(x*dimy+y,))


#Adding binary function and factors"
vis=numpy.ones(5,dtype=opengm.index_type)
#add one binary function (potts fuction)
f=numpy.ones(pow(numLabels,2),dtype=numpy.float32).reshape(numLabels,numLabels)*beta
for l in range(numLabels):
   f[l,l]=0
fid=gm.addFunction(f)
#add binary factors
for y in range(dimy):
   for x in range(dimx):
      if(x+1<dimx):
         #vi as tuple (list and numpy array can also be used as vi's)
         gm.addFactor(fid,numpy.array([x*dimy+y,(x+1)*dimy+y],dtype=opengm.index_type))
      if(y+1<dimy):
         #vi as list (tuple and numpy array can also be used as vi's)
         gm.addFactor(fid,[x*dimy+y,x*dimy+(y+1)])


opengm.hdf5.saveGraphicalModel(gm,'/tmp/model.h5','gm')

icm=opengm.inference.Icm(gm)
icm.infer()
argmin=icm.arg()


res=argmin.reshape(dimx,dimy)
Interpixel-Boundary Segmentation’-Model
This example builds a ‘interpixel-boundary segmentation’ model on a two dimensional grid
Note
TODO: show input and output image for different betas !
Code
import opengm
import numpy
import sys

class TopologicalCoordinateToIndex:
   def __init__(self ,geometricGridSize) :
      self.gridSize=geometricGridSize
   def convert(self, tx,ty) :
      return tx / 2 + (ty / 2)*(self.gridSize[0]) + ((ty + ty % 2) / 2)*(self.gridSize[0] - 1)

def printSolution(data,solution,coordinateHelper):
   for  x   in range (data.shape[0]*2 - 1):
      sys.stdout.write("___")
   sys.stdout.write("\n")
   for  y   in range (data.shape[1]*2 - 1):
      sys.stdout.write("|")
      for  x   in range (data.shape[0]*2 - 1):
         if x % 2 == 0 and y % 2 == 0:
            sys.stdout.write("   ")
         elif x % 2 == 0 and y % 2 == 1 :
            if solution[coordinateHelper.convert(x,y)]==1:
               sys.stdout.write("___")
            else:
               sys.stdout.write("   ")
         elif   x % 2 == 1 and y % 2 == 0  :
            if solution[coordinateHelper.convert(x,y)]==1:
               sys.stdout.write(" | ")
            else:
               sys.stdout.write("   ")
         elif x % 2 == 1 and y % 2 == 1:
               sys.stdout.write(" * ")
      sys.stdout.write("|\n")
   for  x   in range (data.shape[1]*2 - 1):
      sys.stdout.write("___")
   sys.stdout.write("\n")

# model parameter
gridSize=[4,4] # size of grid
beta=0.7     # bias to choose between under- and over-segmentation
high=100       # closedness-enforcing soft-constraint value for forbidden configurations

# size of the topological grid
tGridSize=[2*gridSize[0] -1,2*gridSize[1] -1]
nrOfVariables=gridSize[1]*(gridSize[0]-1)+gridSize[0]*(gridSize[1]-1)
cToVi=TopologicalCoordinateToIndex(gridSize)
# some random data on a grid
data=numpy.random.random(gridSize[0]*gridSize[1]).astype(numpy.float32).reshape(gridSize[0],gridSize[1])
# construct gm
numberOfLabels=numpy.ones(nrOfVariables,dtype=opengm.label_type)*2
gm=opengm.graphicalModel(numberOfLabels)

# 4th closedness-function
fClosedness=numpy.zeros( pow(2,4),dtype=numpy.float32).reshape(2,2,2,2)
for x1 in range(2):
   for x2 in range(2):
      for x3 in range(2):
         for x4 in range(2):
            labelsum=x1+x2+x3+x4
            if labelsum is not 2 and labelsum is not 0 :
               fClosedness[x1,x2,x3,x4]=high
fidClosedness=gm.addFunction(fClosedness)
# for each boundary in the grid, i.e. for each variable
# of the model, add one 1st order functions
# and one 1st order factor
# and for each junction of four inter-pixel edges on the grid,
# one factor is added that connects the corresponding variable
# indices and refers to the closedness-function
for yt in range(tGridSize[1]):
   for xt in range(tGridSize[0]):
      # unaries
      if (xt % 2 + yt % 2) == 1 :
         gradient = abs(  data[xt / 2, yt / 2]- data[xt/ 2 + xt % 2, yt / 2 + yt % 2])
         f=numpy.array([beta*gradient , (1.0-beta)*(1.0-gradient)])
         gm.addFactor(gm.addFunction(f),[cToVi.convert(xt,yt)])
      # high order factors (4.th order)
      if xt % 2 + yt % 2 == 2 :
         vi=[cToVi.convert(xt + 1, yt),cToVi.convert(xt - 1, yt),cToVi.convert(xt, yt + 1), cToVi.convert(xt, yt - 1)]
         vi=sorted(vi);
         gm.addFactor(fidClosedness,vi)

inf=opengm.inference.LazyFlipper(gm,parameter=opengm.InfParam(maxSubgraphSize=4))
inf.inference.infer()
arg=inf.inference.arg()
printSolution(data,arg,cToVi)
Pure Python ICM Solver
This example show how to write inference solvers in python, and shows the usage of the movemaker
Code
import opengm
import numpy

unaries=numpy.random.rand(100 , 100,2)
potts=opengm.PottsFunction([2,2],0.0,0.2)
gm=opengm.grid2d2Order(unaries=unaries,regularizer=potts)

class IcmPurePython():
   def __init__(self,gm):
      self.gm=gm
      self.numVar=gm.numberOfVariables
      self.movemaker=opengm.movemaker(gm)
      self.adj=gm.variablesAdjacency()
      self.localOpt=numpy.zeros(self.numVar,dtype=numpy.bool)
   def infer(self,verbose=False):
      changes=True
      while(changes):
         changes=False
         for v in  self.gm.variables():
            if(self.localOpt[v]==False):
               l=self.movemaker.label(v)
               nl=self.movemaker.moveOptimallyMin(v)
               self.localOpt[v]=True
               if(nl!=l):
                  if(verbose):print self.movemaker.value()
                  self.localOpt[self.adj[v]]=False
                  changes=True
   def arg(self):
      argLabels=numpy.zeros(self.numVar,dtype=opengm.label_type)
      for v in  self.gm.variables():
         argLabels[v]=self.movemaker.label(v)
      return argLabels

icm=IcmPurePython(gm)
icm.infer(verbose=False)
arg=icm.arg()
print arg.reshape(100,100)
Iterate over a factors value table with a ‘shapeWalker’
This example show how to iterate over all possible labelings of a factor
import opengm
import numpy

# some graphical model
# -with 3 variables with 4 labels.
# -with 2 random 2-order functions
# -connected to 2 factors
gm=opengm.gm([4]*3)
f=numpy.random.rand(4,4).astype(numpy.float32)
gm.addFactor(gm.addFunction(f),[0,1])
f=numpy.random.rand(4,4).astype(numpy.float32)
gm.addFactor(gm.addFunction(f),[1,2])

# iterate over all factors of the graphical model
for factor in gm.factors():
    # iterate over all labelings with a "shape walker"
    for coord in opengm.shapeWalker(f.shape):
        print " f[",coord,"]=",factor[coord]
Pure Python Visitors
This example shows how to write a pure python visitor for inference. In this example the current state of the solver is reshaped as a 2d image since the model is a 2d grid.
Code
"""
Usage: python_visitor_gui.py

This script shows how one can implement visitors
in pure python and inject them into OpenGM solver.
( not all OpenGM solvers support this kind of
    code injection )
"""

import opengm
import numpy
import matplotlib
from matplotlib import pyplot as plt


shape=[100,100]
numLabels=10
unaries=numpy.random.rand(shape[0], shape[1],numLabels)
potts=opengm.PottsFunction([numLabels,numLabels],0.0,0.4)
gm=opengm.grid2d2Order(unaries=unaries,regularizer=potts)
inf=opengm.inference.BeliefPropagation(gm,parameter=opengm.InfParam(damping=0.5))

class PyCallback(object):
    def __init__(self,shape,numLabels):
        self.shape=shape
        self.numLabels=numLabels
        self.cmap = matplotlib.colors.ListedColormap ( numpy.random.rand ( self.numLabels,3))
        matplotlib.interactive(True)
    def begin(self,inference):
        print "begin of inference"
    def end(self,inference):
        print "end of inference"
    def visit(self,inference):
        gm=inference.gm()
        labelVector=inference.arg()
        print "energy  ",gm.evaluate(labelVector)
        labelVector=labelVector.reshape(self.shape)
        plt.imshow(labelVector*255.0, cmap=self.cmap,interpolation="nearest")
        plt.draw()


callback=PyCallback(shape,numLabels)
visitor=inf.pythonVisitor(callback,visitNth=1)

inf.infer(visitor)
argmin=inf.arg()
MRF - Benchmark
Mrf-Benchmark Models implemented in Opengm Python:
Stereo matching problems:
Note
This example will be there soon.
Photomontage problems:
Note
This example will be there soon.
Binary image segmentation problems:
Note
This example will be there soon.
Denoising and Inpainting problems:
Code:
# FIXMEEEEEEEEEEE

import opengm
import vigra    # only to read images
import numpy
#import sys

# to animate the current labeling matplotlib is used
import matplotlib
import matplotlib.pyplot as plt
import matplotlib.cm as cm
from matplotlib import animation


class PyCallback(object):
    """
    callback functor which will be passed to an inference
    visitor.
    In that way, pure python code can be injected into the c++ inference.
    This functor visualizes the labeling as an image during inference.

    Args :
        shape : shape of the image
        numLabels : number of labels
    """
    def __init__(self,shape,numLabels):
        self.shape=shape
        self.numLabels=numLabels
        matplotlib.interactive(True)
    def begin(self,inference):
        """
        this function is called from c++ when inference is started

        Args :
            inference : python wrapped c++ solver which is passed from c++
        """
        print "begin"
    def end(self,inference):
        """
        this function is called from c++ when inference ends

        Args :
            inference : python wrapped c++ solver which is passed from c++
        """
        print "end"
    def visit(self,inference):
        """
        this function is called from c++ each time the visitor is called

        Args :
            inference : python wrapped c++ solver which is passed from c++
        """

        arg = inference.arg()
        gm  = inference.gm()
        print "energy ",gm.evaluate(arg)

        arg=arg.reshape(self.shape)*255
        plt.imshow(arg.T, cmap='gray',interpolation="nearest")
        plt.draw()


def denoiseModel(
    img,
    norm                    = 2,
    weight                  = 1.0,
    truncate                = None,
    numLabels               = 256,
    neighbourhood           = 4,
    inpaintPixels           = None,
    randInpaitStartingPoint = False
):
    """
    this function is used to set up a graphical model similar to
    **Denoising and inpainting problems:** from `Mrf- Benchmark <http://vision.middlebury.edu/MRF/results/ >`_

    Args :
        img           : a grayscale image in the range [0,256)
        norm          : used norm for unaries and 2-order functions (default : 2)
        weight        : weight of 2-order functions (default : 1.0)
        truncate      : Truncate second order function at an given value (defaut : None)
        numLabels     : number of labels for each variable in the graphical model,
                        set this to a lower number to speed up inference  (default : 255)
        neighbourhood : neighbourhood for the second order functions, so far only 4 is allowed (default : 4)
        inpaintPixels : a tuple of x and y coordinates where no unaries are added
        randInpaitStartingPoint : use a random starting point for all pixels without unaries (default : False)
    """
    shape = img.shape
    if(img.ndim!=2):
        raise RuntimeError("image must be gray")
    if neighbourhood != 4 :
        raise RuntimeError("A neighbourhood other than 4 is not yet implemented")

    # normalize and flatten image
    iMin    = numpy.min(img)
    iMax    = numpy.max(img)
    imgNorm = ((img[:,:]-iMin)/(iMax-iMin))*float(numLabels)
    imgFlat = imgNorm.reshape(-1).astype(numpy.uint64)

    # Set up Grapical Model:
    numVar = int(img.size)
    gm = opengm.gm([numLabels]*numVar,operator='adder')
    gm.reserveFunctions(numLabels,'explicit')
    numberOfPairwiseFactors=shape[0]*(shape[1]-1) + shape[1]*(shape[0]-1)
    gm.reserveFactors(numVar-len(inpaintPixels[0]) + numberOfPairwiseFactors )

    # Set up unaries:
    # - create a range of all possible labels
    allPossiblePixelValues=numpy.arange(numLabels)
    pixelValueRep    = numpy.repeat(allPossiblePixelValues[:,numpy.newaxis],numLabels,1)
    # - repeat [0,1,2,3,...,253,254,255] numVar times
    labelRange = numpy.arange(numLabels,dtype=opengm.value_type)
    labelRange = numpy.repeat(labelRange[numpy.newaxis,:], numLabels, 0)
    unaries = numpy.abs(pixelValueRep - labelRange)**norm
    # - add unaries to the graphical model
    fids=gm.addFunctions(unaries.astype(opengm.value_type))
    # add unary factors to graphical model
    if(inpaintPixels is None):
        for l in xrange(numLabels):
            whereL=numpy.where(imgFlat==l)
            gm.addFactors(fids[l],whereL[0].astype(opengm.index_type))
    else:
        # get vis of inpaint pixels
        ipX  = inpaintPixels[0]
        ipY  = inpaintPixels[1]
        ipVi = ipX*shape[1] + ipY

        for l in xrange(numLabels):
            whereL=numpy.where(imgFlat==l)
            notInInpaint=numpy.setdiff1d(whereL[0],ipVi)
            gm.addFactors(fids[l],notInInpaint.astype(opengm.index_type))

    # add ONE second order function
    f=opengm.differenceFunction(shape=[numLabels,numLabels],norm=2,weight=weight,truncate=truncate)
    fid=gm.addFunction(f)
    vis2Order=opengm.secondOrderGridVis(shape[0],shape[1],True)
    # add all second order factors
    gm.addFactors(fid,vis2Order)

    # create a starting point
    startingPoint = imgFlat.copy()
    if randInpaitStartingPoint :
        startingPointRandom = numpy.random.randint(0,numLabels,size=numVar).astype(opengm.index_type)

        ipVi = inpaintPixels[0]*shape[1] + inpaintPixels[1]
        for x in ipVi:
            startingPoint[x]=startingPointRandom[x]

    startingPoint[startingPoint==numLabels]=numLabels-1
    return gm,startingPoint.astype(opengm.index_type)


if __name__ == "__main__":

    # setup
    imgPath   = 'houseM-input.png'
    norm      = 2
    weight    = 5.0
    numLabels = 50   # use 256 for full-model (slow)

    # Read image
    img   = numpy.array(numpy.squeeze(vigra.impex.readImage(imgPath)),dtype=opengm.value_type)#[0:100,0:40]
    shape = img.shape

    # get graphical model an starting point
    gm,startingPoint=denoiseModel(img,norm=norm,weight=weight,inpaintPixels=numpy.where(img==0),
                                  numLabels=numLabels,randInpaitStartingPoint=True)

    inf=opengm.inference.Imc(gm,parameter=opengm.InfParam())


    print "inf"
    inf.setStartingPoint(inf.arg())
        # set up visitor
    callback=PyCallback(shape,numLabels)
    visitor=inf.pythonVisitor(callback,visitNth=1)
    inf.infer(visitor)
    # get the result
    arg=inf.arg()
    arg=arg.reshape(shape)

    # plot final result
    matplotlib.interactive(False)
    # Two subplots, the axes array is 1-d
    f, axarr = plt.subplots(1,2)
    axarr[0].imshow(img.T, cmap = cm.Greys_r)
    axarr[0].set_title('Input Image')
    axarr[1].imshow(arg.T, cmap = cm.Greys_r)
    axarr[1].set_title('Solution')
    plt.show()
Result:
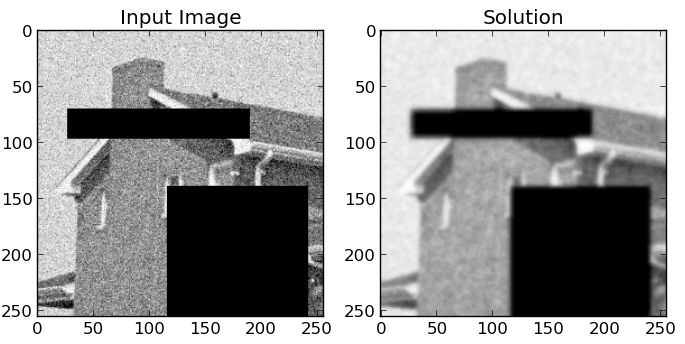
This is the result if icm is used as a solver. The model has 50 Labels, and a weight of 5.0. No truncation has been used.