Note
Click here to download the full example code
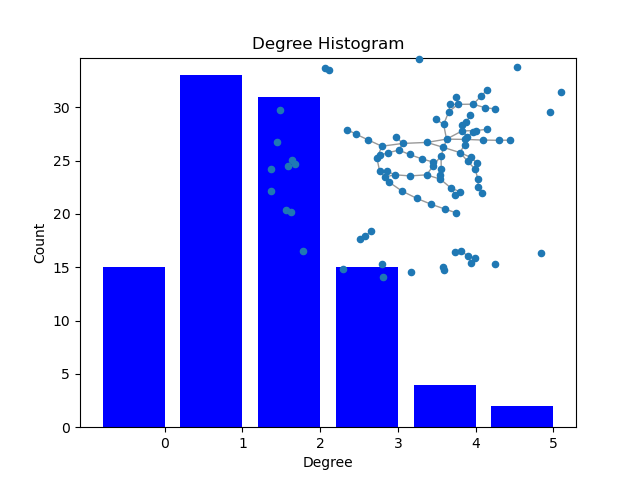
Degree histogram
Draw degree histogram with matplotlib. Random graph shown as inset
import collections
import matplotlib.pyplot as plt
import networkx as nx

G = nx.gnp_random_graph(100, 0.02)

degree_sequence = sorted([d for n, d in G.degree()], reverse=True)  # degree sequence
degreeCount = collections.Counter(degree_sequence)
deg, cnt = zip(*degreeCount.items())

fig, ax = plt.subplots()
plt.bar(deg, cnt, width=0.80, color="b")

plt.title("Degree Histogram")
plt.ylabel("Count")
plt.xlabel("Degree")
ax.set_xticks([d + 0.4 for d in deg])
ax.set_xticklabels(deg)

# draw graph in inset
plt.axes([0.4, 0.4, 0.5, 0.5])
Gcc = G.subgraph(sorted(nx.connected_components(G), key=len, reverse=True)[0])
pos = nx.spring_layout(G)
plt.axis("off")
nx.draw_networkx_nodes(G, pos, node_size=20)
nx.draw_networkx_edges(G, pos, alpha=0.4)
plt.show()
Total running time of the script: ( 0 minutes 0.209 seconds)