Note
Click here to download the full example code
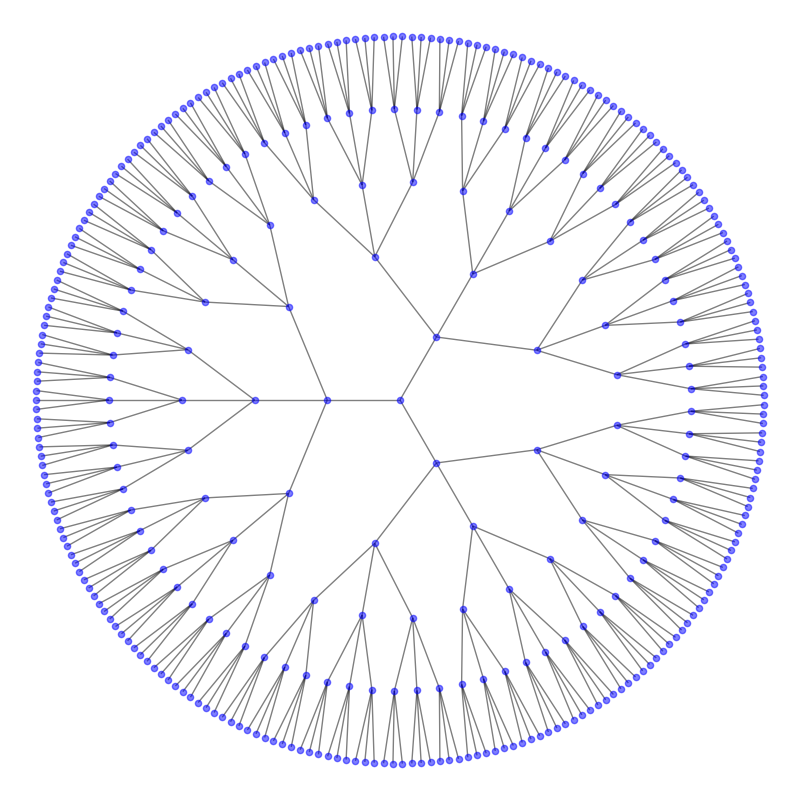
Circular Tree
import matplotlib.pyplot as plt
import networkx as nx

# This example needs Graphviz and either PyGraphviz or pydot
# from networkx.drawing.nx_pydot import graphviz_layout
from networkx.drawing.nx_agraph import graphviz_layout


G = nx.balanced_tree(3, 5)
pos = graphviz_layout(G, prog="twopi", args="")
plt.figure(figsize=(8, 8))
nx.draw(G, pos, node_size=20, alpha=0.5, node_color="blue", with_labels=False)
plt.axis("equal")
plt.show()
Total running time of the script: ( 0 minutes 0.254 seconds)