Near-Sided Perspective Projection
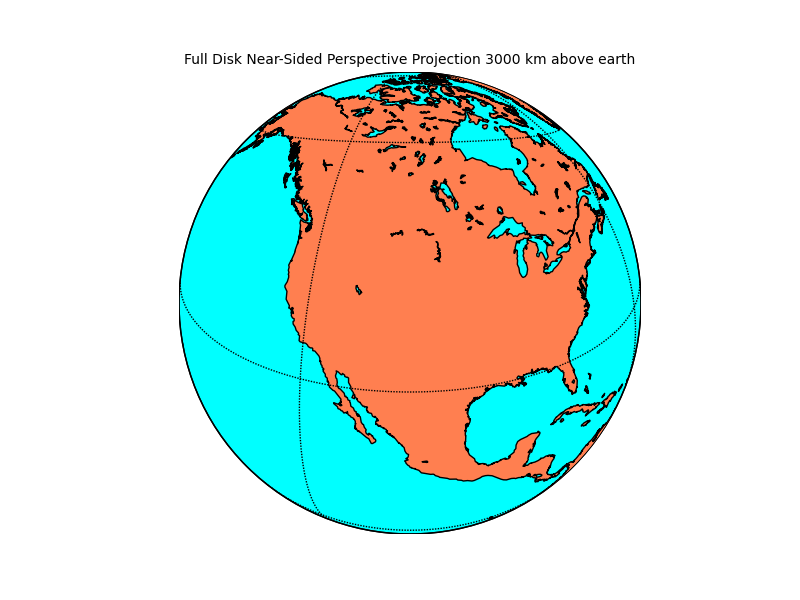
The near-sided perspective projection displays the earth as a satellite (in orbit at an arbitrary altitude above the earth) would see it.
from mpl_toolkits.basemap import Basemap
import numpy as np
import matplotlib.pyplot as plt
# lon_0, lat_0 are the center point of the projection.
# satellite_height is the altitude of the camera.
# resolution = 'l' means use low resolution coastlines.
h = 3000.
m = Basemap(projection='nsper',lon_0=-105,lat_0=40,
        satellite_height=h*1000.,resolution='l')
m.drawcoastlines()
m.fillcontinents(color='coral',lake_color='aqua')
# draw parallels and meridians.
m.drawparallels(np.arange(-90.,120.,30.))
m.drawmeridians(np.arange(0.,420.,60.))
m.drawmapboundary(fill_color='aqua')
plt.title("Full Disk Near-Sided Perspective Projection %d km above earth" %
        h,fontsize=10)
plt.show()
from mpl_toolkits.basemap import Basemap
import numpy as np
import matplotlib.pyplot as plt
fig = plt.figure()
# global ortho map centered on lon_0,lat_0
lat_0=10.; lon_0=57.
# altitude of camera (in km).
h = 3000.
# resolution = None means don't process the boundary datasets.
m1 = Basemap(projection='nsper',satellite_height=h*1000.,\
        lon_0=lon_0,lat_0=lat_0,resolution=None)
# add an axes with a black background
ax = fig.add_axes([0.1,0.1,0.8,0.8],axisbg='k')
# plot just upper right quadrant (corners determined from global map).
# keywords llcrnrx,llcrnry,urcrnrx,urcrnry used to define the lower
# left and upper right corners in map projection coordinates.
# llcrnrlat,llcrnrlon,urcrnrlon,urcrnrlat could be used to define
# lat/lon values of corners - but this won't work in cases such as this
# where one of the corners does not lie on the earth.
m = Basemap(projection='nsper',satellite_height=h*1000.,\
        lon_0=lon_0,lat_0=lat_0,resolution='l',\
    llcrnrx=0.,llcrnry=0.,urcrnrx=m1.urcrnrx/2.,urcrnry=m1.urcrnry/2.)
m.drawcoastlines()
m.drawmapboundary(fill_color='aqua')
m.fillcontinents(color='coral',lake_color='aqua')
m.drawcountries()
# draw parallels and meridians.
m.drawparallels(np.arange(-90.,120.,30.))
m.drawmeridians(np.arange(0.,360.,60.))
m.drawmapboundary()
plt.title('Near-Sided Perspective Map Showing A Quadrant of the Globe',\
          fontsize=12)
plt.show()