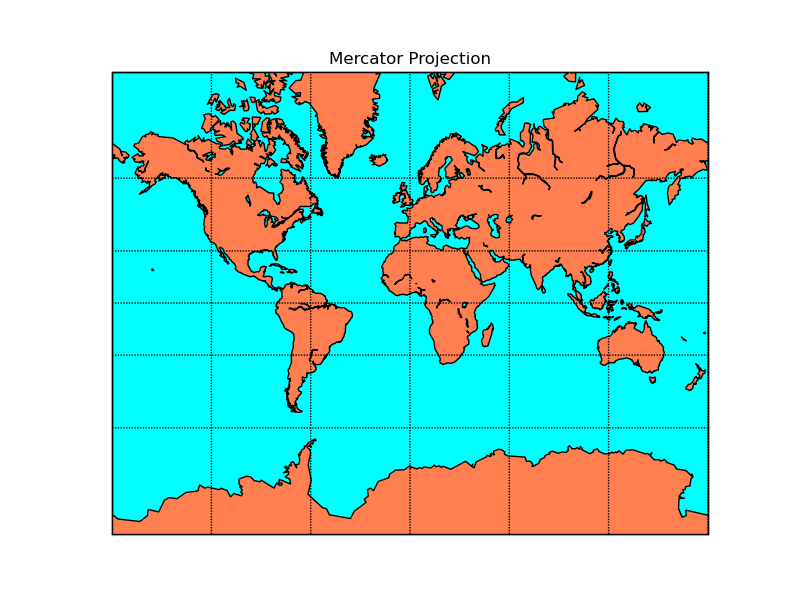
Mercator Projection
A cylindrical, conformal projection. Very large distortion at high latitudes, cannot fully reach the polar regions.
from mpl_toolkits.basemap import Basemap
import numpy as np
import matplotlib.pyplot as plt
# llcrnrlat,llcrnrlon,urcrnrlat,urcrnrlon
# are the lat/lon values of the lower left and upper right corners
# of the map.
# lat_ts is the latitude of true scale.
# resolution = 'c' means use crude resolution coastlines.
m = Basemap(projection='merc',llcrnrlat=-80,urcrnrlat=80,\
            llcrnrlon=-180,urcrnrlon=180,lat_ts=20,resolution='c')
m.drawcoastlines()
m.fillcontinents(color='coral',lake_color='aqua')
# draw parallels and meridians.
m.drawparallels(np.arange(-90.,91.,30.))
m.drawmeridians(np.arange(-180.,181.,60.))
m.drawmapboundary(fill_color='aqua')
plt.title("Mercator Projection")
plt.show()