Converting to and from map projection coordinates
In order to plot data on a map, the coordinates of the data must
be given in map projection coordinates.
Calling a Basemap class instance with the arguments lon, lat will
convert lon/lat (in degrees) to x/y map projection coordinates
(in meters). The inverse transformation is done if the optional keyword
inverse is set to True.
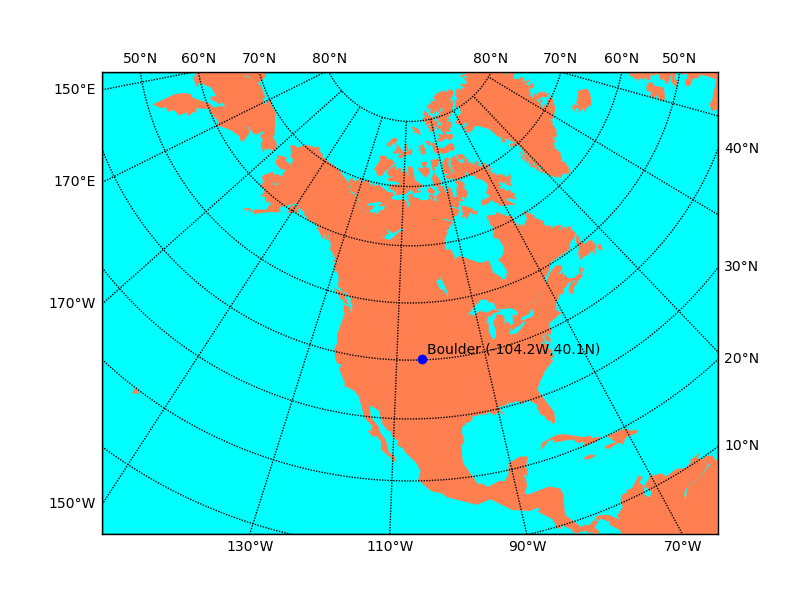
Here’s an example that uses this feature to plot a marker and some text to
denote the location of Boulder, CO, given the lat/lon position.
from mpl_toolkits.basemap import Basemap
import matplotlib.pyplot as plt
import numpy as np
# setup Lambert Conformal basemap.
m = Basemap(width=12000000,height=9000000,projection='lcc',
            resolution='c',lat_1=45.,lat_2=55,lat_0=50,lon_0=-107.)
# draw a boundary around the map, fill the background.
# this background will end up being the ocean color, since
# the continents will be drawn on top.
m.drawmapboundary(fill_color='aqua')
# fill continents, set lake color same as ocean color.
m.fillcontinents(color='coral',lake_color='aqua')
# draw parallels and meridians.
# label parallels on right and top
# meridians on bottom and left
parallels = np.arange(0.,81,10.)
# labels = [left,right,top,bottom]
m.drawparallels(parallels,labels=[False,True,True,False])
meridians = np.arange(10.,351.,20.)
m.drawmeridians(meridians,labels=[True,False,False,True])
# plot blue dot on Boulder, colorado and label it as such.
lon, lat = -104.237, 40.125 # Location of Boulder
# convert to map projection coords.
# Note that lon,lat can be scalars, lists or numpy arrays.
xpt,ypt = m(lon,lat)
# convert back to lat/lon
lonpt, latpt = m(xpt,ypt,inverse=True)
m.plot(xpt,ypt,'bo')  # plot a blue dot there
# put some text next to the dot, offset a little bit
# (the offset is in map projection coordinates)
plt.text(xpt+100000,ypt+100000,'Boulder (%5.1fW,%3.1fN)' % (lonpt,latpt))
plt.show()