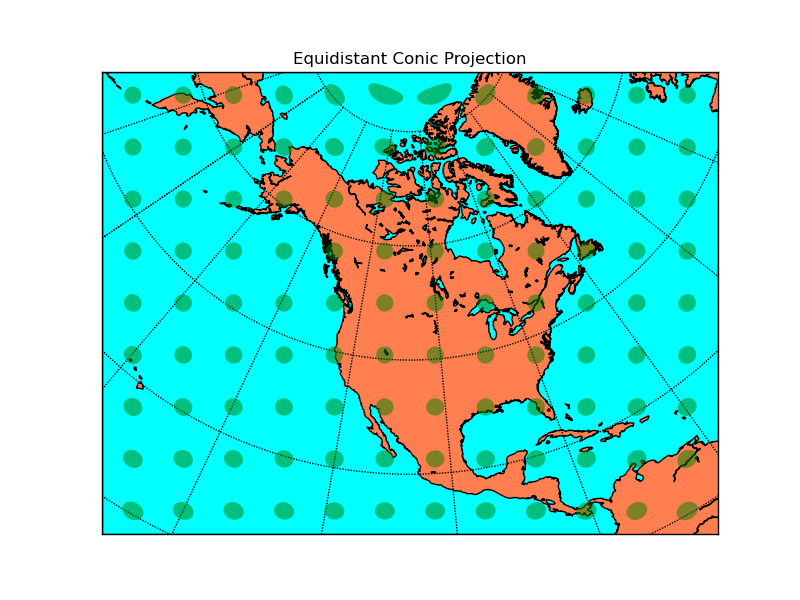
Equidistant Conic Projection
Neither conformal or equal area. Parallels are equally spaced. The green shapes drawn on the map are equal-area circles on the surface of the earth. Known as “Tissot’s indicatrix”, they can be used to show the angular and areal distortion of a map projection. On a conformal projection, the shape of the circles is preserved, but the area is not. On a equal-area projection, the area is preserved but the shape is not.
from mpl_toolkits.basemap import Basemap
import numpy as np
import matplotlib.pyplot as plt
# setup equidistant conic basemap.
# lat_1 is first standard parallel.
# lat_2 is second standard parallel.
# lon_0,lat_0 is central point.
# resolution = 'l' for low-resolution coastlines.
m = Basemap(width=12000000,height=9000000,
            resolution='l',projection='eqdc',\
            lat_1=45.,lat_2=55,lat_0=50,lon_0=-107.)
m.drawcoastlines()
m.fillcontinents(color='coral',lake_color='aqua')
# draw parallels and meridians.
m.drawparallels(np.arange(-80.,81.,20.))
m.drawmeridians(np.arange(-180.,181.,20.))
m.drawmapboundary(fill_color='aqua')
ax = plt.gca()
for y in np.linspace(m.ymax/20,19*m.ymax/20,9):
    for x in np.linspace(m.xmax/20,19*m.xmax/20,12):
        lon, lat = m(x,y,inverse=True)
        poly = m.tissot(lon,lat,1.5,100,\
                        facecolor='green',zorder=10,alpha=0.5)
plt.title("Equidistant Conic Projection")
plt.show()