Azimuthal Equidistant Projection
The shortest route from the center of the map
to any other point is a straight line in the azimuthal
equidistant projection.
So, for the specified point, all points that lie on a circle around
this point are equidistant on the surface of the earth on this projection.
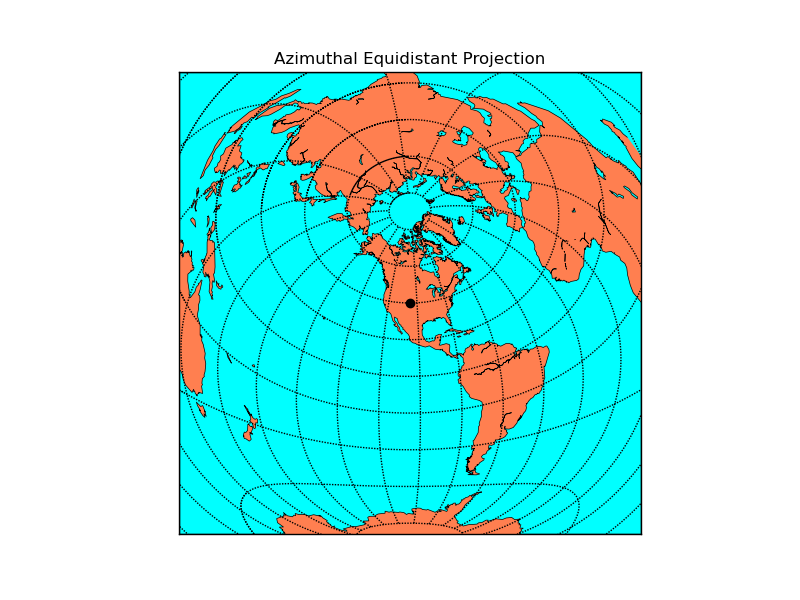
The specified point lon_0, lat_0 shows up as a black dot in the center of the map.
Here’s an example using the width and height keywords to specify the map region.
from mpl_toolkits.basemap import Basemap
import numpy as np
import matplotlib.pyplot as plt
width = 28000000; lon_0 = -105; lat_0 = 40
m = Basemap(width=width,height=width,projection='aeqd',
            lat_0=lat_0,lon_0=lon_0)
# fill background.
m.drawmapboundary(fill_color='aqua')
# draw coasts and fill continents.
m.drawcoastlines(linewidth=0.5)
m.fillcontinents(color='coral',lake_color='aqua')
# 20 degree graticule.
m.drawparallels(np.arange(-80,81,20))
m.drawmeridians(np.arange(-180,180,20))
# draw a black dot at the center.
xpt, ypt = m(lon_0, lat_0)
m.plot([xpt],[ypt],'ko')
# draw the title.
plt.title('Azimuthal Equidistant Projection')
plt.show()
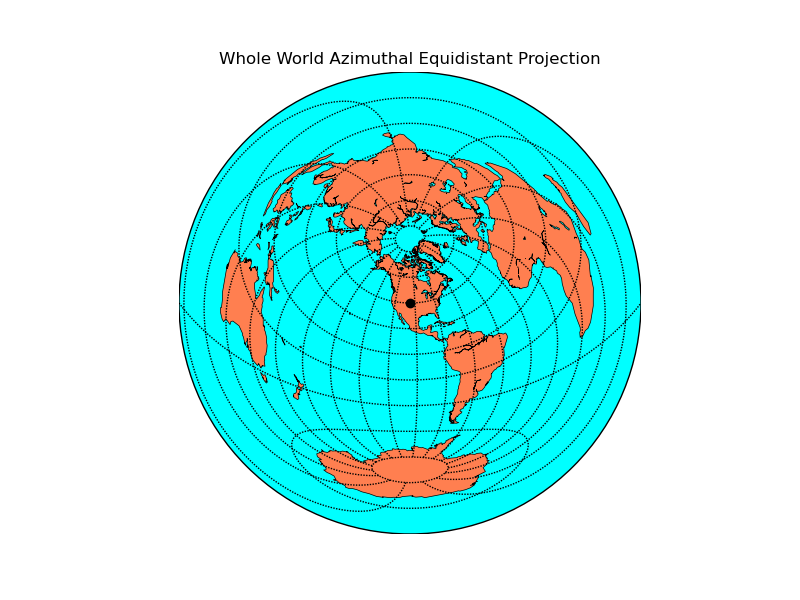
If both the width/height and corner lat/lon keywords are omitted, the whole world is plotted in a circle.
from mpl_toolkits.basemap import Basemap
import numpy as np
import matplotlib.pyplot as plt
lon_0 = -105; lat_0 = 40
m = Basemap(projection='aeqd',lat_0=lat_0,lon_0=lon_0)
# fill background.
m.drawmapboundary(fill_color='aqua')
# draw coasts and fill continents.
m.drawcoastlines(linewidth=0.5)
m.fillcontinents(color='coral',lake_color='aqua')
# 20 degree graticule.
m.drawparallels(np.arange(-80,81,20))
m.drawmeridians(np.arange(-180,180,20))
# draw a black dot at the center.
xpt, ypt = m(lon_0, lat_0)
m.plot([xpt],[ypt],'ko')
# draw the title.
plt.title('Whole World Azimuthal Equidistant Projection')
plt.show()