Albers Equal Area Projection
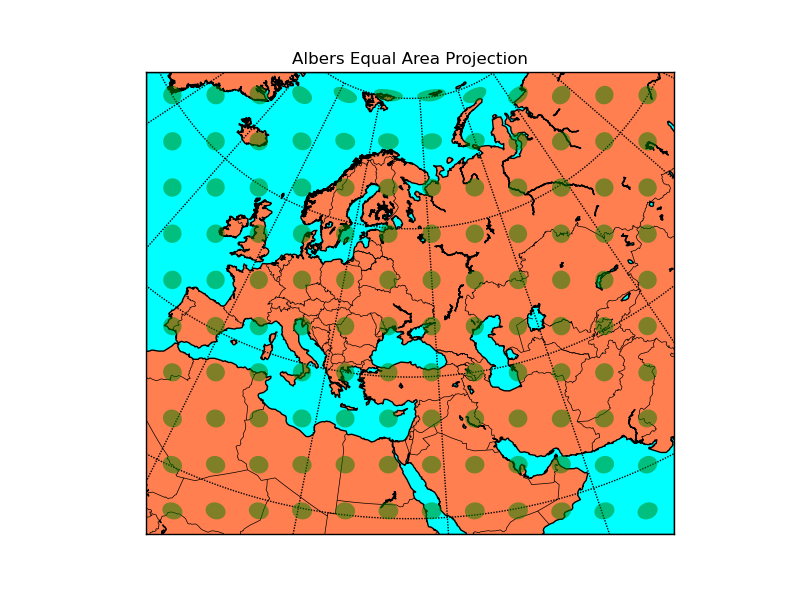
An equal-area projection. The green shapes drawn on the map are equal-area circles on the surface of the earth. Known as “Tissot’s indicatrix”, they can be used to show the angular and areal distortion of a map projection. On a conformal projection, the shape of the circles is preserved, but the area is not. On a equal-area projection, the area is preserved but the shape is not.
Distortion is very large near the poles in this projection.
from mpl_toolkits.basemap import Basemap
import numpy as np
import matplotlib.pyplot as plt
# setup albers equal area conic basemap
# lat_1 is first standard parallel.
# lat_2 is second standard parallel.
# lon_0,lat_0 is central point.
m = Basemap(width=8000000,height=7000000,
            resolution='l',projection='aea',\
            lat_1=40.,lat_2=60,lon_0=35,lat_0=50)
m.drawcoastlines()
m.drawcountries()
m.fillcontinents(color='coral',lake_color='aqua')
# draw parallels and meridians.
m.drawparallels(np.arange(-80.,81.,20.))
m.drawmeridians(np.arange(-180.,181.,20.))
m.drawmapboundary(fill_color='aqua')
# draw tissot's indicatrix to show distortion.
ax = plt.gca()
for y in np.linspace(m.ymax/20,19*m.ymax/20,10):
    for x in np.linspace(m.xmax/20,19*m.xmax/20,12):
        lon, lat = m(x,y,inverse=True)
        poly = m.tissot(lon,lat,1.25,100,\
                        facecolor='green',zorder=10,alpha=0.5)
plt.title("Albers Equal Area Projection")
plt.show()