Note
Go to the end to download the full example code.
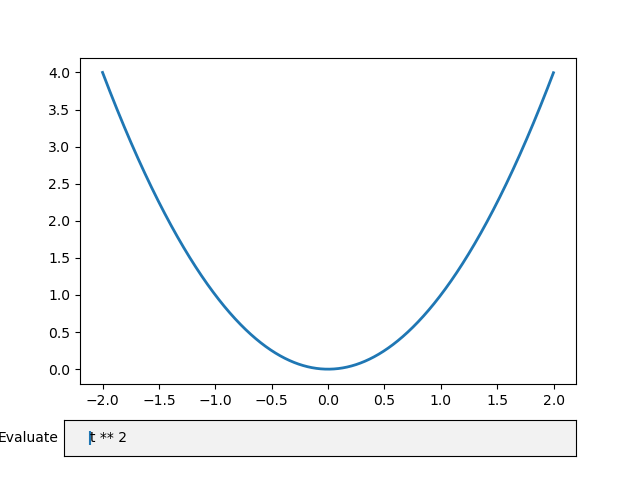
Textbox#
The Textbox widget lets users interactively provide text input, including
formulas. In this example, the plot is updated using the on_submit method.
This method triggers the execution of the submit function when the
user presses enter in the textbox or leaves the textbox.
Note: The matplotlib.widgets.TextBox widget is different from the following
static elements: Annotations and
Placing text boxes.
import matplotlib.pyplot as plt
import numpy as np

from matplotlib.widgets import TextBox

fig, ax = plt.subplots()
fig.subplots_adjust(bottom=0.2)

t = np.arange(-2.0, 2.0, 0.001)
l, = ax.plot(t, np.zeros_like(t), lw=2)


def submit(expression):
    """
    Update the plotted function to the new math *expression*.

    *expression* is a string using "t" as its independent variable, e.g.
    "t ** 3".
    """
    ydata = eval(expression, {'np': np}, {'t': t})
    l.set_ydata(ydata)
    ax.relim()
    ax.autoscale_view()
    plt.draw()


axbox = fig.add_axes([0.1, 0.05, 0.8, 0.075])
text_box = TextBox(axbox, "Evaluate", textalignment="center")
text_box.on_submit(submit)
text_box.set_val("t ** 2")  # Trigger `submit` with the initial string.

plt.show()
References
The use of the following functions, methods, classes and modules is shown in this example: