Note
Click here to download the full example code
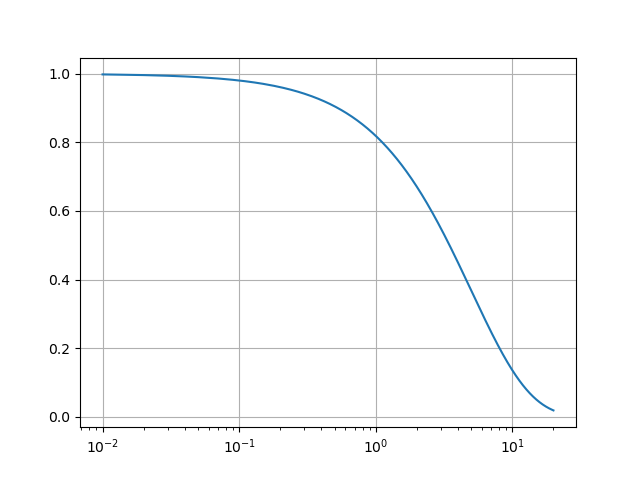
Log Axis
This is an example of assigning a log-scale for the x-axis using
semilogx.
import matplotlib.pyplot as plt
import numpy as np

fig, ax = plt.subplots()

dt = 0.01
t = np.arange(dt, 20.0, dt)

ax.semilogx(t, np.exp(-t / 5.0))
ax.grid()

plt.show()
Keywords: matplotlib code example, codex, python plot, pyplot Gallery generated by Sphinx-Gallery