Note
Click here to download the full example code
Easily creating subplots
In early versions of matplotlib, if you wanted to use the pythonic API and create a figure instance and from that create a grid of subplots, possibly with shared axes, it involved a fair amount of boilerplate code. e.g.
import matplotlib.pyplot as plt
import numpy as np


# Fixing random state for reproducibility
np.random.seed(19680801)

x = np.random.randn(50)

# old style
fig = plt.figure()
ax1 = fig.add_subplot(221)
ax2 = fig.add_subplot(222, sharex=ax1, sharey=ax1)
ax3 = fig.add_subplot(223, sharex=ax1, sharey=ax1)
ax3 = fig.add_subplot(224, sharex=ax1, sharey=ax1)
Fernando Perez has provided the nice top-level function
subplots (note the "s" at the end) to create
everything at once, and turn on x and y sharing for the whole bunch.
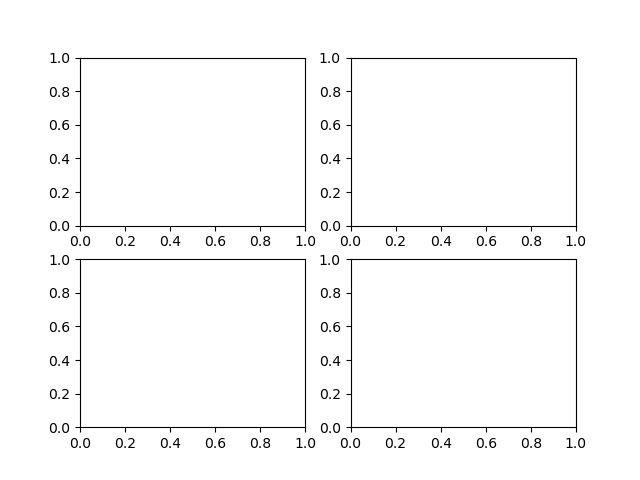
You can either unpack the axes individually...
# new style method 1; unpack the axes
fig, ((ax1, ax2), (ax3, ax4)) = plt.subplots(2, 2, sharex=True, sharey=True)
ax1.plot(x)

Out:
[<matplotlib.lines.Line2D object at 0x7f73b4c1ea60>]
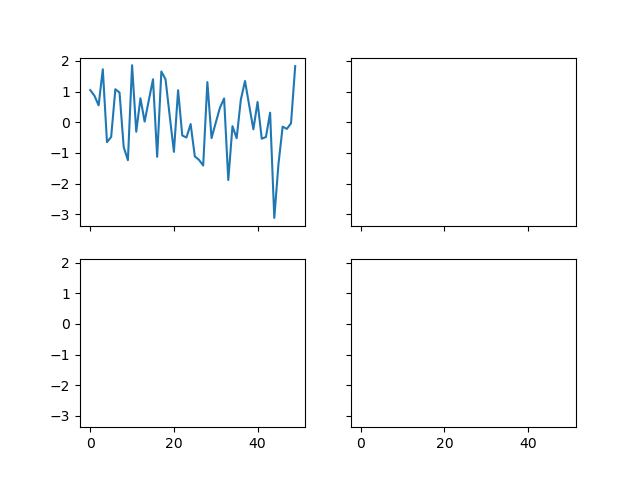
or get them back as a numrows x numcolumns object array which supports numpy indexing
# new style method 2; use an axes array
fig, axs = plt.subplots(2, 2, sharex=True, sharey=True)
axs[0, 0].plot(x)

plt.show()
Total running time of the script: ( 0 minutes 2.029 seconds)
Keywords: matplotlib code example, codex, python plot, pyplot Gallery generated by Sphinx-Gallery