Note
Go to the end to download the full example code.
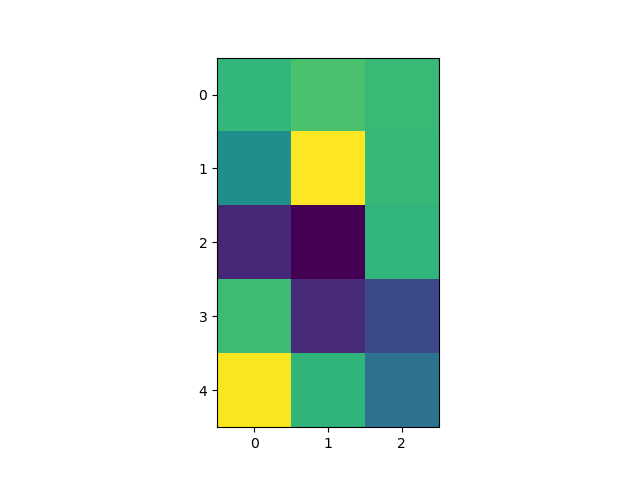
Modifying the coordinate formatter#
Modify the coordinate formatter to report the image "z" value of the nearest
pixel given x and y. This functionality is built in by default; this example
just showcases how to customize the format_coord function.
import matplotlib.pyplot as plt
import numpy as np

# Fixing random state for reproducibility
np.random.seed(19680801)


X = 10*np.random.rand(5, 3)

fig, ax = plt.subplots()
ax.imshow(X)


def format_coord(x, y):
    col = round(x)
    row = round(y)
    nrows, ncols = X.shape
    if 0 <= col < ncols and 0 <= row < nrows:
        z = X[row, col]
        return f'x={x:1.4f}, y={y:1.4f}, z={z:1.4f}'
    else:
        return f'x={x:1.4f}, y={y:1.4f}'


ax.format_coord = format_coord
plt.show()
References
The use of the following functions, methods, classes and modules is shown in this example: