Note
Go to the end to download the full example code.
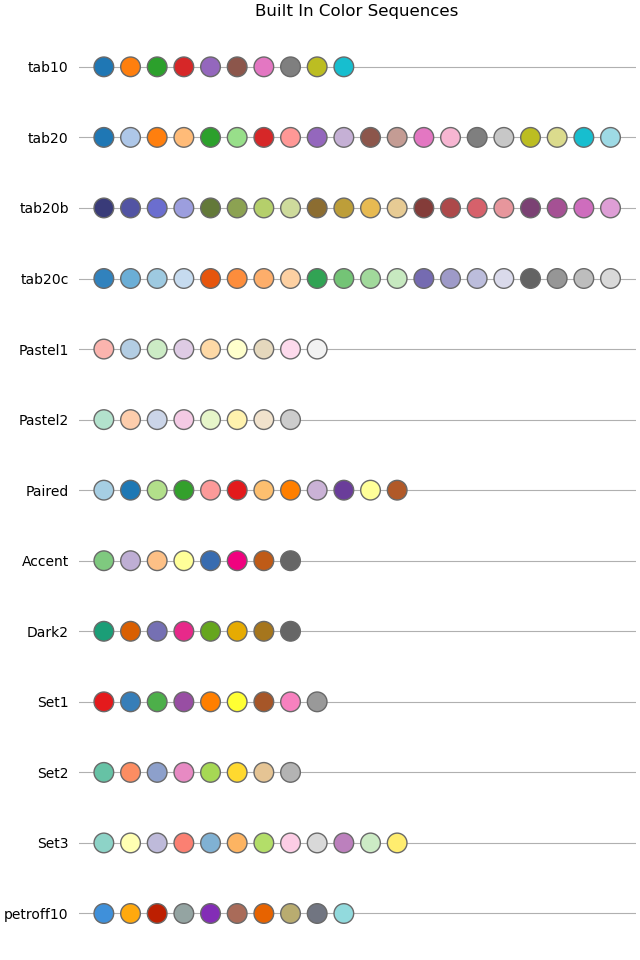
Named color sequences#
Matplotlib's ColorSequenceRegistry allows access to
predefined lists of colors by name e.g.
colors = matplotlib.color_sequences['Set1']. This example shows all of the
built in color sequences.
User-defined sequences can be added via ColorSequenceRegistry.register.
import matplotlib.pyplot as plt
import numpy as np

import matplotlib as mpl


def plot_color_sequences(names, ax):
    # Display each named color sequence horizontally on the supplied axes.

    for n, name in enumerate(names):
        colors = mpl.color_sequences[name]
        n_colors = len(colors)
        x = np.arange(n_colors)
        y = np.full_like(x, n)

        ax.scatter(x, y, facecolor=colors, edgecolor='dimgray', s=200, zorder=2)

    ax.set_yticks(range(len(names)), labels=names)
    ax.grid(visible=True, axis='y')
    ax.yaxis.set_inverted(True)
    ax.xaxis.set_visible(False)
    ax.spines[:].set_visible(False)
    ax.tick_params(left=False)


built_in_color_sequences = [
    'tab10', 'tab20', 'tab20b', 'tab20c', 'Pastel1', 'Pastel2', 'Paired',
    'Accent', 'Dark2', 'Set1', 'Set2', 'Set3', 'petroff10']


fig, ax = plt.subplots(figsize=(6.4, 9.6), layout='constrained')

plot_color_sequences(built_in_color_sequences, ax)
ax.set_title('Built In Color Sequences')

plt.show()
References
The use of the following functions, methods, classes and modules is shown in this example: