matplotlib.pyplot.pcolor#
- matplotlib.pyplot.pcolor(*args, shading=None, alpha=None, norm=None, cmap=None, vmin=None, vmax=None, colorizer=None, data=None, **kwargs)[source]#
Create a pseudocolor plot with a non-regular rectangular grid.
Call signature:
pcolor([X, Y,] C, /, **kwargs)
X and Y can be used to specify the corners of the quadrilaterals.
The arguments X, Y, C are positional-only.
Hint
pcolor()can be very slow for large arrays. In most cases you should use the similar but much fasterpcolormeshinstead. See Differences between pcolor() and pcolormesh() for a discussion of the differences.- Parameters:
- C2D array-like
The color-mapped values. Color-mapping is controlled by cmap, norm, vmin, and vmax.
- X, Yarray-like, optional
The coordinates of the corners of quadrilaterals of a pcolormesh:
(X[i+1, j], Y[i+1, j])       (X[i+1, j+1], Y[i+1, j+1])
                      ●╶───╴●
                      │     │
                      ●╶───╴●
    (X[i, j], Y[i, j])       (X[i, j+1], Y[i, j+1])
Note that the column index corresponds to the x-coordinate, and the row index corresponds to y. For details, see the Notes section below.
If
shading='flat'the dimensions of X and Y should be one greater than those of C, and the quadrilateral is colored due to the value atC[i, j]. If X, Y and C have equal dimensions, a warning will be raised and the last row and column of C will be ignored.If
shading='nearest', the dimensions of X and Y should be the same as those of C (if not, a ValueError will be raised). The colorC[i, j]will be centered on(X[i, j], Y[i, j]).If X and/or Y are 1-D arrays or column vectors they will be expanded as needed into the appropriate 2D arrays, making a rectangular grid.
- shading{'flat', 'nearest', 'auto'}, default:
rcParams["pcolor.shading"](default:'auto') The fill style for the quadrilateral. Possible values:
'flat': A solid color is used for each quad. The color of the quad (i, j), (i+1, j), (i, j+1), (i+1, j+1) is given by
C[i, j]. The dimensions of X and Y should be one greater than those of C; if they are the same as C, then a deprecation warning is raised, and the last row and column of C are dropped.'nearest': Each grid point will have a color centered on it, extending halfway between the adjacent grid centers. The dimensions of X and Y must be the same as C.
'auto': Choose 'flat' if dimensions of X and Y are one larger than C. Choose 'nearest' if dimensions are the same.
See pcolormesh grids and shading for more description.
- cmapstr or
Colormap, default:rcParams["image.cmap"](default:'viridis') The Colormap instance or registered colormap name used to map scalar data to colors.
- normstr or
Normalize, optional The normalization method used to scale scalar data to the [0, 1] range before mapping to colors using cmap. By default, a linear scaling is used, mapping the lowest value to 0 and the highest to 1.
If given, this can be one of the following:
An instance of
Normalizeor one of its subclasses (see Colormap normalization).A scale name, i.e. one of "linear", "log", "symlog", "logit", etc. For a list of available scales, call
matplotlib.scale.get_scale_names(). In that case, a suitableNormalizesubclass is dynamically generated and instantiated.
- vmin, vmaxfloat, optional
When using scalar data and no explicit norm, vmin and vmax define the data range that the colormap covers. By default, the colormap covers the complete value range of the supplied data. It is an error to use vmin/vmax when a norm instance is given (but using a
strnorm name together with vmin/vmax is acceptable).- colorizer
Colorizeror None, default: None The Colorizer object used to map color to data. If None, a Colorizer object is created from a norm and cmap.
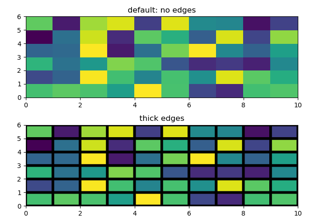
- edgecolors{'none', None, 'face', color, color sequence}, optional
The color of the edges. Defaults to 'none'. Possible values:
'none' or '': No edge.
None:
rcParams["patch.edgecolor"](default:'black') will be used. Note that currentlyrcParams["patch.force_edgecolor"](default:False) has to be True for this to work.'face': Use the adjacent face color.
A color or sequence of colors will set the edge color.
The singular form edgecolor works as an alias.
- alphafloat, default: None
The alpha blending value of the face color, between 0 (transparent) and 1 (opaque). Note: The edgecolor is currently not affected by this.
- snapbool, default: False
Whether to snap the mesh to pixel boundaries.
- Returns:
- Other Parameters:
- antialiasedsbool, default: False
The default antialiaseds is False if the default edgecolors="none" is used. This eliminates artificial lines at patch boundaries, and works regardless of the value of alpha. If edgecolors is not "none", then the default antialiaseds is taken from
rcParams["patch.antialiased"](default:True). Stroking the edges may be preferred if alpha is 1, but will cause artifacts otherwise.- dataindexable object, optional
If given, all parameters also accept a string
s, which is interpreted asdata[s]ifsis a key indata.- **kwargs
Additionally, the following arguments are allowed. They are passed along to the
PolyQuadMeshconstructor:Property
Description
a filter function, which takes a (m, n, 3) float array and a dpi value, and returns a (m, n, 3) array and two offsets from the bottom left corner of the image
array-like or float or None
bool
antialiasedoraaorantialiasedsbool or list of bools
array-like or None
CapStyleor {'butt', 'projecting', 'round'}(vmin: float, vmax: float)
BboxBaseor Nonebool
Patch or (Path, Transform) or None
Colormapor str or Nonecolor or list of RGBA tuples
edgecolororecoredgecolorsfacecolororfacecolorsorfcstr
{'/', '\', '|', '-', '+', 'x', 'o', 'O', '.', '*'}
unknown
bool
JoinStyleor {'miter', 'round', 'bevel'}object
linestyleordashesorlinestylesorlsstr or tuple or list thereof
linewidthorlinewidthsorlwfloat or list of floats
bool
Normalizeor str or None(N, 2) or (2,) array-like
list of
AbstractPathEffectlist of array-like
None or bool or float or callable
float
bool
sizesnumpy.ndarrayor None(scale: float, length: float, randomness: float)
bool or None
str
list of str or None
list of array-like
unknown
bool
float
See also
pcolormeshfor an explanation of the differences between pcolor and pcolormesh.
imshowIf X and Y are each equidistant,
imshowcan be a faster alternative.
Notes
Note
This is the pyplot wrapper for
axes.Axes.pcolor.Masked arrays
X, Y and C may be masked arrays. If either
C[i, j], or one of the vertices surroundingC[i, j](X or Y at[i, j], [i+1, j], [i, j+1], [i+1, j+1]) is masked, nothing is plotted.Grid orientation
The grid orientation follows the standard matrix convention: An array C with shape (nrows, ncolumns) is plotted with the column number as X and the row number as Y.
Examples using matplotlib.pyplot.pcolor#
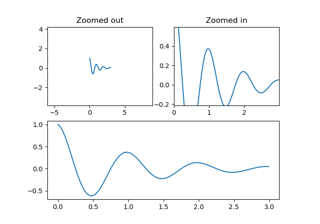
Controlling view limits using margins and sticky_edges