matplotlib.pyplot.acorr#
- matplotlib.pyplot.acorr(x, *, data=None, **kwargs)[source]#
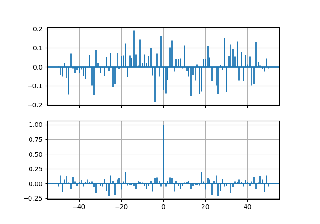
Plot the autocorrelation of x.
- Parameters:
- xarray-like
Not run through Matplotlib's unit conversion, so this should be a unit-less array.
- detrendcallable, default:
mlab.detrend_none(no detrending) A detrending function applied to x. It must have the signature
detrend(x: np.ndarray) -> np.ndarray
- normedbool, default: True
If
True, input vectors are normalised to unit length.- usevlinesbool, default: True
Determines the plot style.
If
True, vertical lines are plotted from 0 to the acorr value usingAxes.vlines. Additionally, a horizontal line is plotted at y=0 usingAxes.axhline.If
False, markers are plotted at the acorr values usingAxes.plot.- maxlagsint, default: 10
Number of lags to show. If
None, will return all2 * len(x) - 1lags.
- Returns:
- lagsarray (length
2*maxlags+1) The lag vector.
- carray (length
2*maxlags+1) The auto correlation vector.
- line
LineCollectionorLine2D Artistadded to the Axes of the correlation:LineCollectionif usevlines is True.Line2Dif usevlines is False.
- b
Line2Dor None Horizontal line at 0 if usevlines is True None usevlines is False.
- lagsarray (length
- Other Parameters:
- linestyle
Line2Dproperty, optional The linestyle for plotting the data points. Only used if usevlines is
False.- markerstr, default: 'o'
The marker for plotting the data points. Only used if usevlines is
False.- dataindexable object, optional
If given, the following parameters also accept a string
s, which is interpreted asdata[s]ifsis a key indata:x
- **kwargs
Additional parameters are passed to
Axes.vlinesandAxes.axhlineif usevlines isTrue; otherwise they are passed toAxes.plot.
- linestyle
Notes
Note
This is the pyplot wrapper for
axes.Axes.acorr.The cross correlation is performed with
numpy.correlatewithmode = "full".