Ctrl+K
You are reading documentation for the unreleased version of Matplotlib. Try searching for the released version of this page instead?
Matplotlib 3.10.1+dfsg1 documentation - Home Matplotlib 3.10.1+dfsg1 documentation - Home
  • Plot types
  • User guide
  • Tutorials
  • Examples
  • Reference
  • Contribute
  • Releases
  • Gitter
  • Discourse
  • GitHub
  • Twitter
  • Plot types
  • User guide
  • Tutorials
  • Examples
  • Reference
  • Contribute
  • Releases
  • Gitter
  • Discourse
  • GitHub
  • Twitter

Section Navigation

  • matplotlib
  • matplotlib.animation
  • matplotlib.artist
  • matplotlib.axes
  • matplotlib.axis
  • matplotlib.backend_bases
  • matplotlib.backend_managers
  • matplotlib.backend_tools
  • matplotlib.backends
  • matplotlib.bezier
  • matplotlib.category
  • matplotlib.cbook
  • matplotlib.cm
  • matplotlib.collections
  • matplotlib.colorbar
  • matplotlib.colorizer
  • matplotlib.colors
    • matplotlib.colors.Normalize
    • matplotlib.colors.NoNorm
    • matplotlib.colors.AsinhNorm
    • matplotlib.colors.BoundaryNorm
    • matplotlib.colors.CenteredNorm
    • matplotlib.colors.FuncNorm
    • matplotlib.colors.LogNorm
    • matplotlib.colors.PowerNorm
    • matplotlib.colors.SymLogNorm
    • matplotlib.colors.TwoSlopeNorm
    • matplotlib.colors.Colormap
    • matplotlib.colors.LinearSegmentedColormap
    • matplotlib.colors.ListedColormap
    • matplotlib.colors.BivarColormap
    • matplotlib.colors.SegmentedBivarColormap
    • matplotlib.colors.BivarColormapFromImage
    • matplotlib.colors.ColorSequenceRegistry
    • matplotlib.colors.LightSource
    • matplotlib.colors.from_levels_and_colors
    • matplotlib.colors.hsv_to_rgb
    • matplotlib.colors.rgb_to_hsv
    • matplotlib.colors.to_hex
    • matplotlib.colors.to_rgb
    • matplotlib.colors.to_rgba
    • matplotlib.colors.to_rgba_array
    • matplotlib.colors.is_color_like
    • matplotlib.colors.same_color
    • matplotlib.colors.get_named_colors_mapping
    • matplotlib.colors.make_norm_from_scale
  • matplotlib.container
  • matplotlib.contour
  • matplotlib.dates
  • matplotlib.dviread
  • matplotlib.figure
  • matplotlib.font_manager
  • matplotlib.ft2font
  • matplotlib.gridspec
  • matplotlib.hatch
  • matplotlib.image
  • matplotlib.inset
  • matplotlib.layout_engine
  • matplotlib.legend
  • matplotlib.legend_handler
  • matplotlib.lines
  • matplotlib.markers
  • matplotlib.mathtext
  • matplotlib.mlab
  • matplotlib.offsetbox
  • matplotlib.patches
  • matplotlib.path
  • matplotlib.patheffects
  • matplotlib.pyplot
  • matplotlib.projections
  • matplotlib.quiver
  • matplotlib.rcsetup
  • matplotlib.sankey
  • matplotlib.scale
  • matplotlib.sphinxext.mathmpl
  • matplotlib.sphinxext.plot_directive
  • matplotlib.sphinxext.figmpl_directive
  • matplotlib.sphinxext.roles
  • matplotlib.spines
  • matplotlib.style
  • matplotlib.table
  • matplotlib.testing
  • matplotlib.text
  • matplotlib.texmanager
  • matplotlib.ticker
  • matplotlib.transforms
  • matplotlib.tri
  • matplotlib.typing
  • matplotlib.units
  • matplotlib.widgets
  • matplotlib._afm
  • matplotlib._api
  • matplotlib._docstring
  • matplotlib._enums
  • matplotlib._type1font
  • matplotlib._tight_bbox
  • matplotlib._tight_layout
  • mpl_toolkits.mplot3d
  • mpl_toolkits.axes_grid1
  • mpl_toolkits.axisartist
  • pylab
  • API Reference
  • matplotlib.colors
  • matplotlib.colors.to_rgb

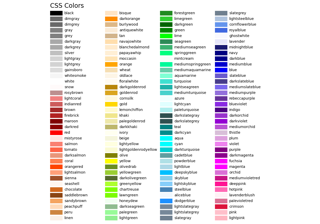
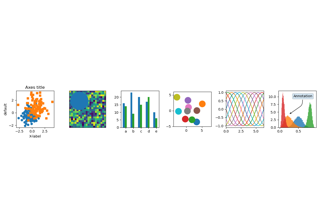
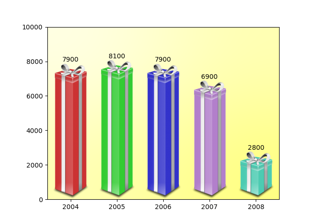
matplotlib.colors.to_rgb#

matplotlib.colors.to_rgb(c)[source]#

Convert c to an RGB color, silently dropping the alpha channel.

Examples using matplotlib.colors.to_rgb#

List of named colors

List of named colors

Style sheets reference

Style sheets reference

Ribbon box

Ribbon box
On this page
  • to_rgb()
  • Examples using matplotlib.colors.to_rgb

© Copyright 2002–2012 John Hunter, Darren Dale, Eric Firing, Michael Droettboom and the Matplotlib development team; 2012–2025 The Matplotlib development team.

Created using Sphinx 8.1.3.

Built from 3.10.1+dfsg1.

Built with the PyData Sphinx Theme 0.16.1.