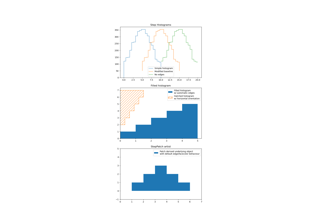
matplotlib.axes.Axes.stairs#
- Axes.stairs(values, edges=None, *, orientation='vertical', baseline=0, fill=False, data=None, **kwargs)[source]#
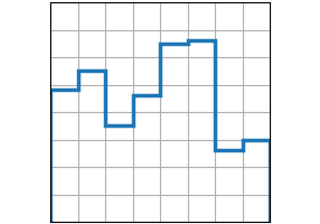
Draw a stepwise constant function as a line or a filled plot.
edges define the x-axis positions of the steps. values the function values between these steps. Depending on fill, the function is drawn either as a continuous line with vertical segments at the edges, or as a filled area.
- Parameters:
- valuesarray-like
The step heights.
- edgesarray-like
The step positions, with
len(edges) == len(vals) + 1, between which the curve takes on vals values.- orientation{'vertical', 'horizontal'}, default: 'vertical'
The direction of the steps. Vertical means that values are along the y-axis, and edges are along the x-axis.
- baselinefloat, array-like or None, default: 0
The bottom value of the bounding edges or when
fill=True, position of lower edge. If fill is True or an array is passed to baseline, a closed path is drawn.If None, then drawn as an unclosed Path.
- fillbool, default: False
Whether the area under the step curve should be filled.
Passing both
fill=True` and ``baseline=Nonewill likely result in undesired filling: the first and last points will be connected with a straight line and the fill will be between this line and the stairs.
- Returns:
- StepPatch
StepPatch
- StepPatch
- Other Parameters:
- dataindexable object, optional
If given, all parameters also accept a string
s, which is interpreted asdata[s]ifsis a key indata.- **kwargs
StepPatchproperties