matplotlib.axes.Axes.secondary_yaxis#
- Axes.secondary_yaxis(location, functions=None, *, transform=None, **kwargs)[source]#
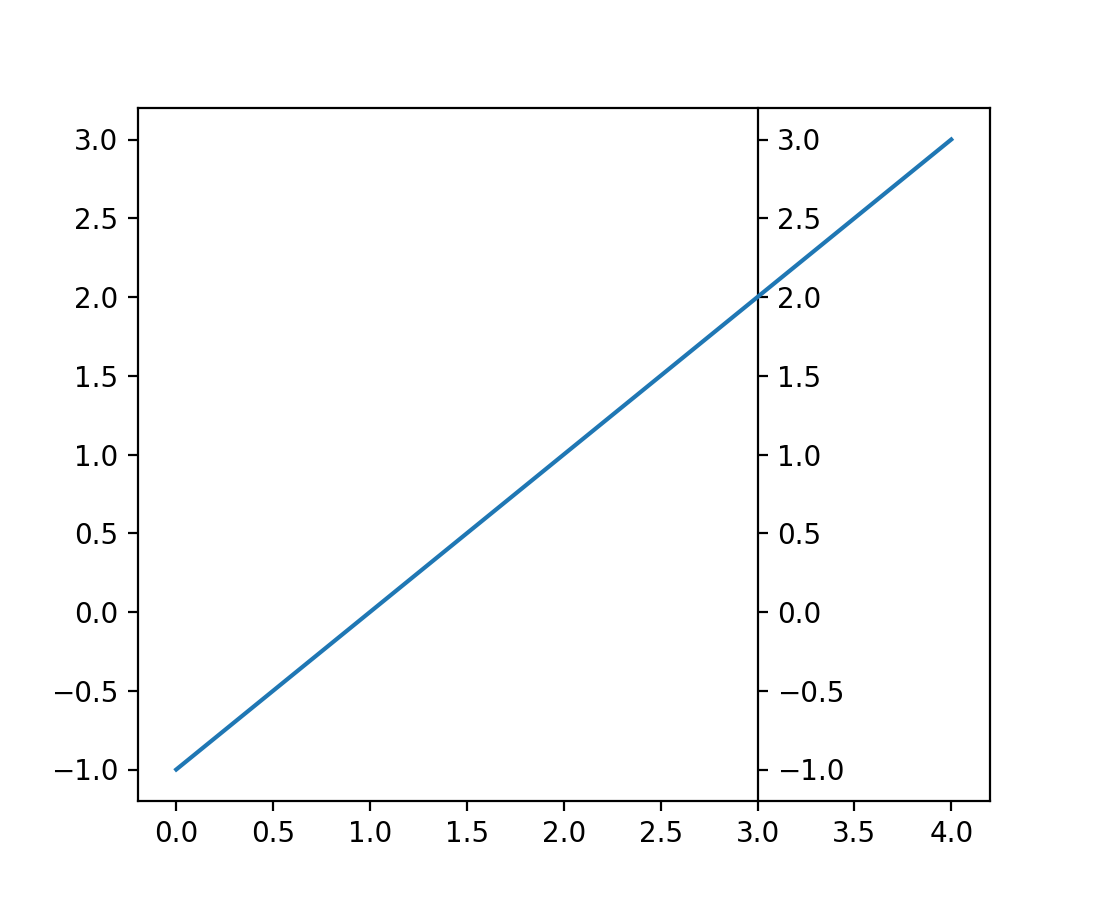
Add a second y-axis to this
Axes.For example if we want to have a second scale for the data plotted on the yaxis.
- Parameters:
- location{'top', 'bottom', 'left', 'right'} or float
The position to put the secondary axis. Strings can be 'top' or 'bottom' for orientation='x' and 'right' or 'left' for orientation='y'. A float indicates the relative position on the parent Axes to put the new Axes, 0.0 being the bottom (or left) and 1.0 being the top (or right).
- functions2-tuple of func, or Transform with an inverse
If a 2-tuple of functions, the user specifies the transform function and its inverse. i.e.
functions=(lambda x: 2 / x, lambda x: 2 / x)would be an reciprocal transform with a factor of 2. Both functions must accept numpy arrays as input.The user can also directly supply a subclass of
transforms.Transformso long as it has an inverse.See Secondary Axis for examples of making these conversions.
- transform
Transform, optional If specified, location will be placed relative to this transform (in the direction of the axis) rather than the parent's axis. i.e. a secondary x-axis will use the provided y transform and the x transform of the parent.
Added in version 3.9.
- Returns:
- axaxes._secondary_axes.SecondaryAxis
- Other Parameters:
- **kwargs
Axesproperties. Other miscellaneous Axes parameters.
- **kwargs
Warning
This method is experimental as of 3.1, and the API may change.
Examples
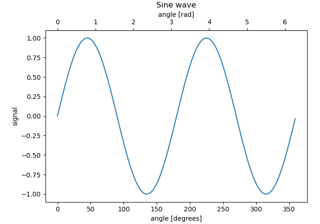
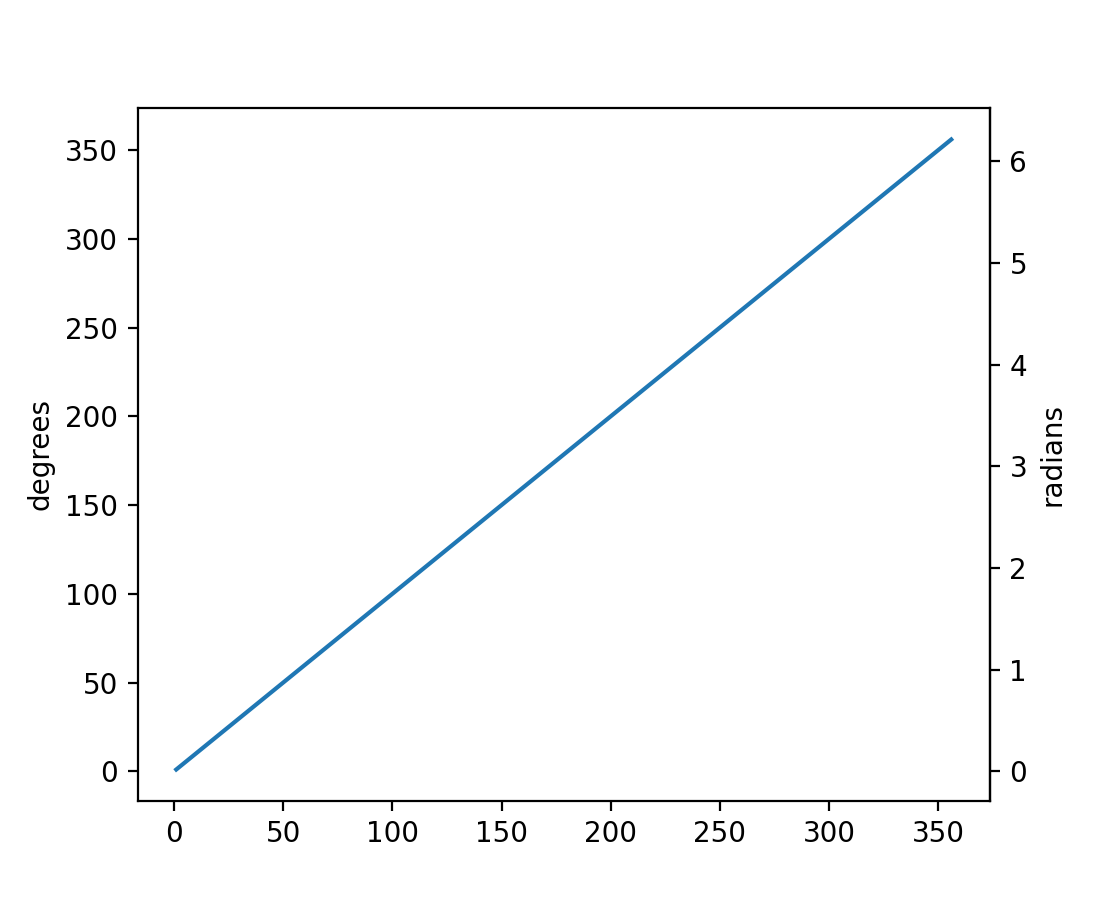
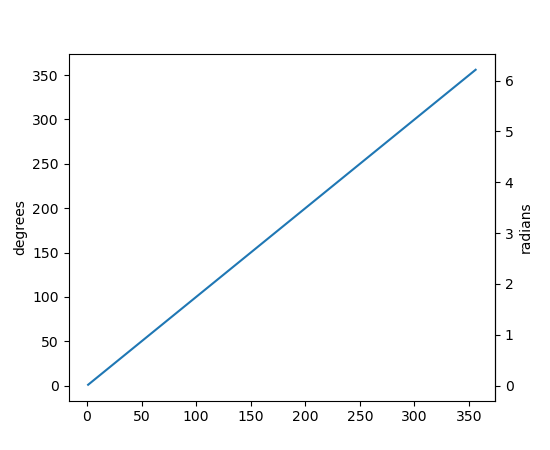
Add a secondary Axes that converts from radians to degrees
(
Source code,2x.png,png)
To add a secondary axis relative to your data, you can pass a transform to the new axis.
(
Source code,2x.png,png)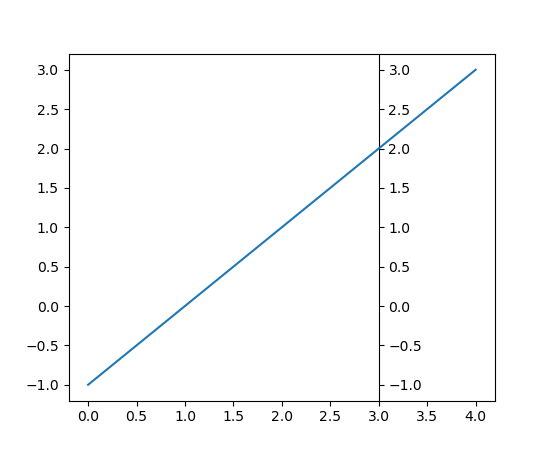

