matplotlib.axes.Axes.pie#
- Axes.pie(x, *, explode=None, labels=None, colors=None, autopct=None, pctdistance=0.6, shadow=False, labeldistance=1.1, startangle=0, radius=1, counterclock=True, wedgeprops=None, textprops=None, center=(0, 0), frame=False, rotatelabels=False, normalize=True, hatch=None, data=None)[source]#
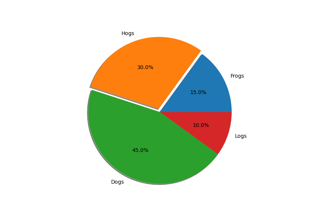
Plot a pie chart.
Make a pie chart of array x. The fractional area of each wedge is given by
x/sum(x).The wedges are plotted counterclockwise, by default starting from the x-axis.
- Parameters:
- x1D array-like
The wedge sizes.
- explodearray-like, default: None
If not None, is a
len(x)array which specifies the fraction of the radius with which to offset each wedge.- labelslist, default: None
A sequence of strings providing the labels for each wedge
- colorscolor or list of color, default: None
A sequence of colors through which the pie chart will cycle. If None, will use the colors in the currently active cycle.
- hatchstr or list, default: None
Hatching pattern applied to all pie wedges or sequence of patterns through which the chart will cycle. For a list of valid patterns, see Hatch style reference.
Added in version 3.7.
- autopctNone or str or callable, default: None
If not None, autopct is a string or function used to label the wedges with their numeric value. The label will be placed inside the wedge. If autopct is a format string, the label will be
fmt % pct. If autopct is a function, then it will be called.- pctdistancefloat, default: 0.6
The relative distance along the radius at which the text generated by autopct is drawn. To draw the text outside the pie, set pctdistance > 1. This parameter is ignored if autopct is
None.- labeldistancefloat or None, default: 1.1
The relative distance along the radius at which the labels are drawn. To draw the labels inside the pie, set labeldistance < 1. If set to
None, labels are not drawn but are still stored for use inlegend.- shadowbool or dict, default: False
If bool, whether to draw a shadow beneath the pie. If dict, draw a shadow passing the properties in the dict to
Shadow.Added in version 3.8: shadow can be a dict.
- startanglefloat, default: 0 degrees
The angle by which the start of the pie is rotated, counterclockwise from the x-axis.
- radiusfloat, default: 1
The radius of the pie.
- counterclockbool, default: True
Specify fractions direction, clockwise or counterclockwise.
- wedgepropsdict, default: None
Dict of arguments passed to each
patches.Wedgeof the pie. For example,wedgeprops = {'linewidth': 3}sets the width of the wedge border lines equal to 3. By default,clip_on=False. When there is a conflict between these properties and other keywords, properties passed to wedgeprops take precedence.- textpropsdict, default: None
Dict of arguments to pass to the text objects.
- center(float, float), default: (0, 0)
The coordinates of the center of the chart.
- framebool, default: False
Plot Axes frame with the chart if true.
- rotatelabelsbool, default: False
Rotate each label to the angle of the corresponding slice if true.
- normalizebool, default: True
When True, always make a full pie by normalizing x so that
sum(x) == 1. False makes a partial pie ifsum(x) <= 1and raises aValueErrorforsum(x) > 1.- dataindexable object, optional
If given, the following parameters also accept a string
s, which is interpreted asdata[s]ifsis a key indata:x, explode, labels, colors
- Returns:
- patcheslist
A sequence of
matplotlib.patches.Wedgeinstances- textslist
A list of the label
Textinstances.- autotextslist
A list of
Textinstances for the numeric labels. This will only be returned if the parameter autopct is not None.
Notes
The pie chart will probably look best if the figure and Axes are square, or the Axes aspect is equal. This method sets the aspect ratio of the axis to "equal". The Axes aspect ratio can be controlled with
Axes.set_aspect.