matplotlib.axes.Axes.hist2d#
- Axes.hist2d(x, y, bins=10, *, range=None, density=False, weights=None, cmin=None, cmax=None, data=None, **kwargs)[source]#
Make a 2D histogram plot.
- Parameters:
- x, yarray-like, shape (n, )
Input values
- binsNone or int or [int, int] or array-like or [array, array]
The bin specification:
If int, the number of bins for the two dimensions (
nx = ny = bins).If
[int, int], the number of bins in each dimension (nx, ny = bins).If array-like, the bin edges for the two dimensions (
x_edges = y_edges = bins).If
[array, array], the bin edges in each dimension (x_edges, y_edges = bins).
The default value is 10.
- rangearray-like shape(2, 2), optional
The leftmost and rightmost edges of the bins along each dimension (if not specified explicitly in the bins parameters):
[[xmin,
xmax], [ymin, ymax]]
. All values outside of this range will be considered outliers and not tallied in the histogram.- densitybool, default: False
Normalize histogram. See the documentation for the density parameter of
histfor more details.- weightsarray-like, shape (n, ), optional
An array of values w_i weighing each sample (x_i, y_i).
- cmin, cmaxfloat, default: None
All bins that has count less than cmin or more than cmax will not be displayed (set to NaN before passing to
pcolormesh) and these count values in the return value count histogram will also be set to nan upon return.
- Returns:
- h2D array
The bi-dimensional histogram of samples x and y. Values in x are histogrammed along the first dimension and values in y are histogrammed along the second dimension.
- xedges1D array
The bin edges along the x-axis.
- yedges1D array
The bin edges along the y-axis.
- image
QuadMesh
- Other Parameters:
- cmapstr or
Colormap, default:rcParams["image.cmap"](default:'viridis') The Colormap instance or registered colormap name used to map scalar data to colors.
- normstr or
Normalize, optional The normalization method used to scale scalar data to the [0, 1] range before mapping to colors using cmap. By default, a linear scaling is used, mapping the lowest value to 0 and the highest to 1.
If given, this can be one of the following:
An instance of
Normalizeor one of its subclasses (see Colormap normalization).A scale name, i.e. one of "linear", "log", "symlog", "logit", etc. For a list of available scales, call
matplotlib.scale.get_scale_names(). In that case, a suitableNormalizesubclass is dynamically generated and instantiated.
- vmin, vmaxfloat, optional
When using scalar data and no explicit norm, vmin and vmax define the data range that the colormap covers. By default, the colormap covers the complete value range of the supplied data. It is an error to use vmin/vmax when a norm instance is given (but using a
strnorm name together with vmin/vmax is acceptable).- colorizer
Colorizeror None, default: None The Colorizer object used to map color to data. If None, a Colorizer object is created from a norm and cmap.
- alpha
0 <= scalar <= 1orNone, optional The alpha blending value.
- dataindexable object, optional
If given, the following parameters also accept a string
s, which is interpreted asdata[s]ifsis a key indata:x, y, weights
- **kwargs
Additional parameters are passed along to the
pcolormeshmethod andQuadMeshconstructor.
- cmapstr or
Notes
Currently
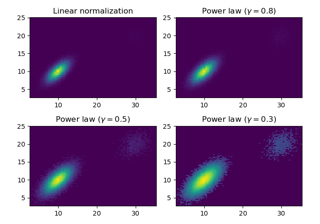
hist2dcalculates its own axis limits, and any limits previously set are ignored.Rendering the histogram with a logarithmic color scale is accomplished by passing a
colors.LogNorminstance to the norm keyword argument. Likewise, power-law normalization (similar in effect to gamma correction) can be accomplished withcolors.PowerNorm.