matplotlib.axes.Axes.add_patch#
Examples using matplotlib.axes.Axes.add_patch#
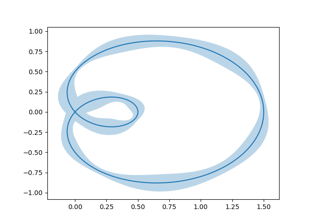
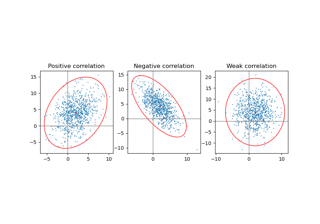
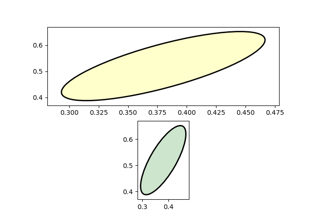
Plot a confidence ellipse of a two-dimensional dataset
Plot a confidence ellipse of a two-dimensional dataset
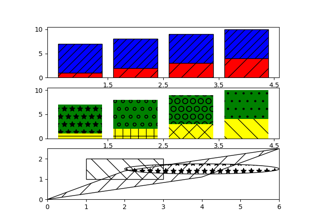

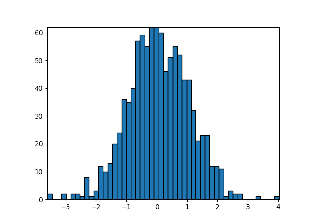
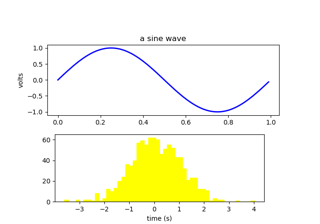
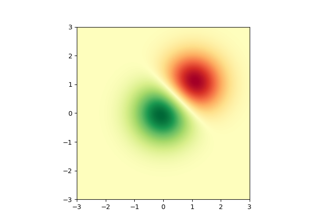
Building histograms using Rectangles and PolyCollections
Building histograms using Rectangles and PolyCollections