Overview
Based on PythonQwt (plotting widgets for Python-Qt graphical user interfaces) and on the scientific modules NumPy and SciPy, guiqwt is a Python library providing efficient 2D data-plotting features (curve/image visualization and related tools) for interactive computing and signal/image processing application development.
Performances
The most popular Python module for data plotting is currently matplotlib, an open-source library providing a lot of plot types and an API (the pylab interface) which is very close to MATLAB’s plotting interface.
guiqwt plotting features are quite limited in terms of plot types compared
to matplotlib. However the currently implemented plot types are much more
efficient.
For example, the guiqwt image showing function (guiqwt.pyplot.imshow())
do not make any copy of the displayed data, hence allowing to show images which
are much larger than with its matplotlib’s counterpart. In other terms, when
showing a 30-MB image (16-bits unsigned integers for example) with guiqwt,
no additional memory is wasted to display the image (except for the offscreen
image of course which depends on the window size) whereas matplotlib takes
more than 600-MB of additional memory (the original array is duplicated four
times using 64-bits float data types).
Features
The guiqwt library also provides the following features:
guiqwt.pyplot: equivalent tomatplotlib.pyplot, at least for the implemented functionssupported plot items:
guiqwt.curve: curves and error bar curves
guiqwt.histogram: 1D histograms
guiqwt.image: images (RGB images are not supported), images with non-linear x/y scales, images with specified pixel size (e.g. loaded from DICOM files), 2D histograms, pseudo-color images (pcolor)
guiqwt.label: labels, curve plot legends
guiqwt.shapes: polygon, polylines, rectangle, circle, ellipse and segment
guiqwt.annotations: annotated shapes (shapes with labels showing position and dimensions): rectangle with center position and size, circle with center position and diameter, ellipse with center position and diameters (these items are very useful to measure things directly on displayed images)curves, images and shapes:
multiple object selection for moving objects or editing their properties through automatically generated dialog boxes (
guidata)item list panel: move objects from foreground to background, show/hide objects, remove objects, …
customizable aspect ratio
a lot of ready-to-use tools: plot canvas export to image file, image snapshot, image rectangular filter, etc.
curves:
interval selection tools with labels showing results of computing on selected area
curve fitting tool with automatic fit, manual fit with sliders, …
images:
contrast adjustment panel: select the LUT by moving a range selection object on the image levels histogram, eliminate outliers, …
X-axis and Y-axis cross-sections: support for multiple images, average cross-section tool on a rectangular area, …
apply any affine transform to displayed images in real-time (rotation, magnification, translation, horizontal/vertical flip, …)
application development helpers:
ready-to-use curve and image plot widgets and dialog boxes (see
guiqwt.plot)load/save graphical objects (curves, images, shapes)
a lot of test scripts which demonstrate guiqwt features (see Examples)
How it works
A guiqwt-based plotting widget may be constructed using one of the following methods:
Interactive mode: when manipulating and visualizing data in an interactive Python or IPython interpreter, the :py:mod`guiqwt.pyplot` module provide the easiest way to plot curves, show images and more. Syntax is similar to MATLAB’s, thus very easy to learn and to use interactively.
Script mode: when manipulating and visualizing data using a script, the :py:mod`guiqwt.pyplot` module is still a good choice as long as you don’t need to customize the figure graphical user interface (GUI) layout. However, if you want to add other widgets to the GUI, like menus, buttons and so on, you should rather use plotting widget classes instead of the pyplot helper functions.
There are two kinds of plotting widgets defined in guiqwt:
low-level plotting widgets:
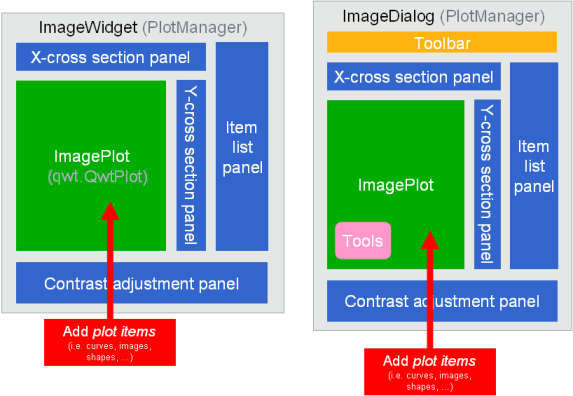
guiqwt.curve.CurvePlotandguiqwt.image.ImagePlothigh-level plotting widgets (ready-to-use widgets with integrated tools and panels):
guiqwt.plot.CurveWidgetandguiqwt.plot.ImageWidget, and corresponding dialog boxesguiqwt.plot.CurveDialogandguiqwt.plot.ImageDialog
Curve-related widgets with integrated plot manager:
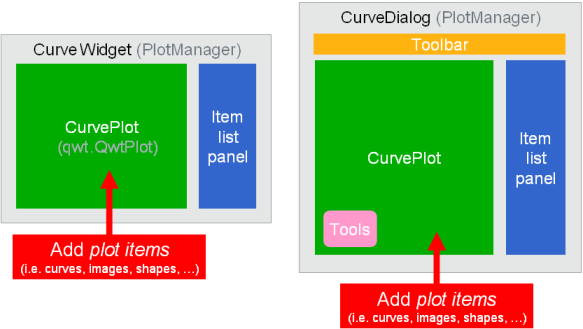
Image-related widgets with integrated plot manager:
See also
- Module
guiqwt.curve Module providing curve-related plot items and plotting widgets
- Module
guiqwt.image Module providing image-related plot items and plotting widgets
- Module
guiqwt.plot Module providing ready-to-use curve and image plotting widgets and dialog boxes