Update Field elements
The EPR C API has been designed to provide read-only features.
PyEPR provides and extra capability consisting in the possibility to
modify (update) an existing ENVISAT Product.
Lets consider a MERIS Level 2 low resolution product (
MER_LRC_2PTGMV20000620_104318_00000104X000_00000_00000_0001.N1).
It has a Band named water_vapour containing the water vapour
content at a specific position.
One can load water vapour and compute an histogram using the following instructions:
FILENAME = "MER_LRC_2PTGMV20000620_104318_00000104X000_00000_00000_0001.N1"

# load original data
with epr.open(FILENAME) as product:
    band = product.get_band("water_vapour")
    wv_orig_histogram, orig_bins = np.histogram(band.read_as_array().flat, 50)
The resulting histogram can be plot using Matplotlib:
# plot water vapour histogram
plt.figure()
plt.bar(orig_bins[:-1], wv_orig_histogram, 0.02, label="original")
plt.grid()
plt.title("Water Vapour Histogram")
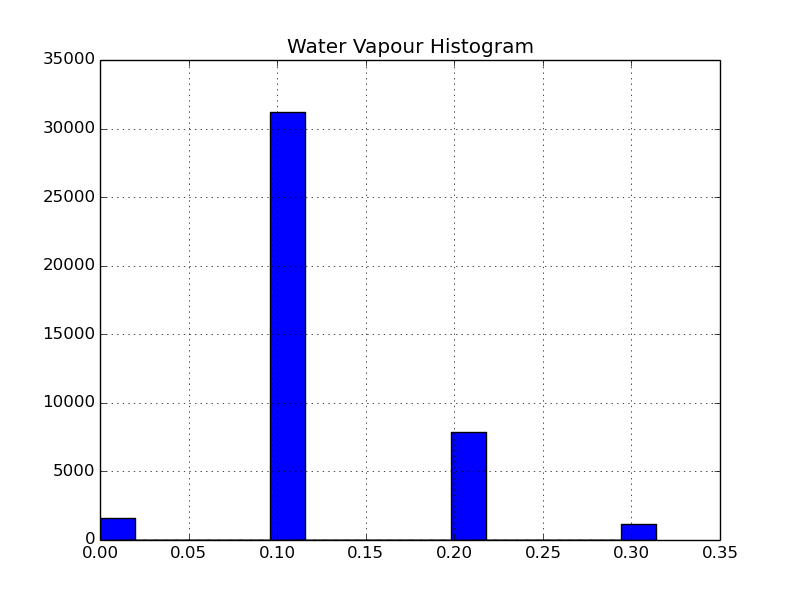
Histogram of the original water vapour content
The actual values of the water vapour content Band are computed
starting form data stored in the Vapour_Content Dataset using
scaling factors contained in the Scaling_Factor_GADS Dataset.
In particular Fields sf_wvapour and off_wvapour are used:
In [21]: dataset = product.get_dataset('Scaling_Factor_GADS')

In [22]: print(dataset)
epr.Dataset(Scaling_Factor_GADS) 1 records

sf_cl_opt_thick = 1.000000
sf_cloud_top_press = 4.027559
sf_wvapour = 0.100000
off_cl_opt_thick = -1.000000
off_cloud_top_press = -4.027559
off_wvapour = -0.100000
spare_1 = <<unknown data type>>
Now suppose that for some reason one needs to update the sf_wvapour scaling
factor for the water vapour content.
Changing the scaling factor, of course, will change all values in the
water_vapour Band.
The change can be performed using the Field.set_elem() and
Field.set_elems() methods of Field objects:
# modily scaling facotrs
with epr.open(FILENAME, "rb+") as product:
    dataset = product.get_dataset("Scaling_Factor_GADS")
    record = dataset.read_record(0)

    field = record.get_field("sf_wvapour")
    scaling = field.get_elem()
    scaling *= 1.1
    field.set_elem(scaling)
Now the sf_wvapour scaling factor has been changed and it is possible to
compute and display the histogram of modified data in the water_vapour
Band:
# re-open the product and load modified data
with epr.open(FILENAME) as product:
    band = product.get_band("water_vapour")
    unit = band.unit
    new_data = band.read_as_array()
    wv_new_histogram, new_bins = np.histogram(new_data.flat, 50)

# plot histogram of modified data
plt.figure()
plt.bar(orig_bins[:-1], wv_orig_histogram, 0.02, label="original")
plt.grid()
plt.title("Water Vapour Histogram")
plt.hold()
plt.bar(new_bins[:-1], wv_new_histogram, 0.02, color="red", label="new")
plt.legend()
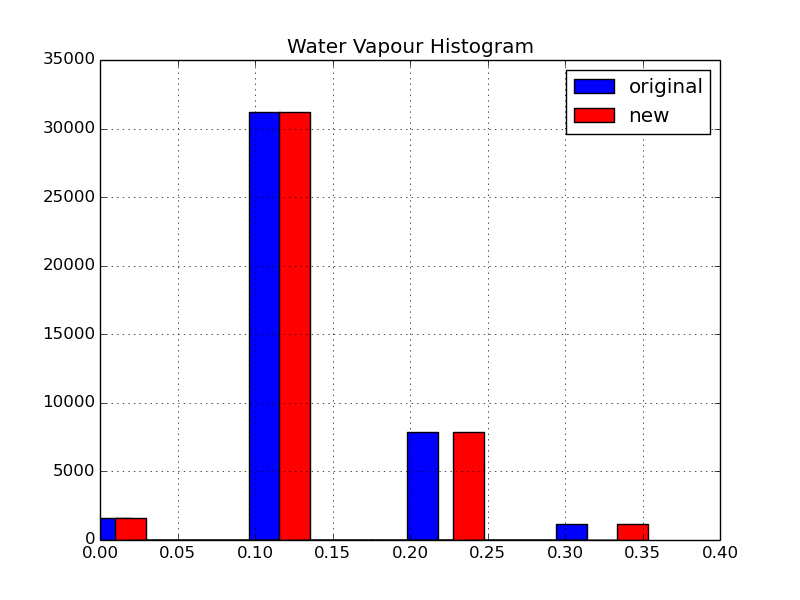
Histogram of the water vapour content (original and modified)
Figure above shows the two different histograms, original data in blue and modified data in red, demonstrating the effect of the change of the scaling factor.
The new map of water vapour is showed in the following picture:
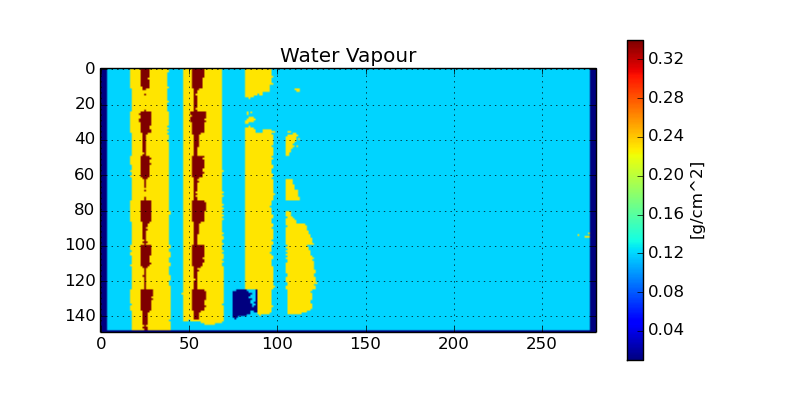
Modified water vapour content map
Important
it is important to stress that it is necessary to close and re-open the
Product in order to see changes in the scaling factors applied
to the water_vapourBand data.
This is a limitation of the current implementation that could be removed in future versions of the PyEPR package.
It has been showed that changing the sf_wvapour scaling factor modifies
all values of the water_vapour Band.
Now suppose that one needs to modify only a specific area.
It can be done changing the contents of the Vapour_Content Dataset.
The Dataset size can be read form the Product:
In [44]: product.get_scene_height(), product.get_scene_width()
Out[44]: (149, 281)
while information about the fields in each record can be retrieved
introspecting the Record object:
In [49]: record = dataset.read_record(0)

In [50]: record.get_field_names()
Out[50]: ['dsr_time', 'quality_flag', 'wvapour_cont_pix']

In [51]: record.get_field('wvapour_cont_pix')
Out[51]: epr.Field("wvapour_cont_pix") 281 uchar elements
So the name of the Field we need to change is the wvapour_cont_pix,
and its index is 2.
It is possible to change a small box inside the Dataset as follows:
# modify the "Vapour_Content" dataset
with epr.open(FILENAME, "rb+") as product:
    dataset = product.get_dataset("Vapour_Content")
    for line in range(70, 100):
        record = dataset.read_record(line)
        field = record.get_field_at(2)
        elems = field.get_elems()
        elems[50:100] = 0
        field.set_elems(elems)
Please note that when one modifies the content of a Dataset he/she
should also take into account id the corresponding band has lines mirrored
or not:
In [59]: band = p.get_band('water_vapour')

In [60]: band.lines_mirrored
Out[60]: True
Finally the Product can be re-opened to load and display the
modified Band:
with epr.open(FILENAME) as product:
    band = product.get_band("water_vapour")
    unit = band.unit
    data = band.read_as_array()

# plot the water vapour map
plt.figure(figsize=(8, 4))
plt.imshow(data)
plt.grid()
plt.title("Water Vapour with box")
cb = plt.colorbar()
cb.set_label(f"[{unit}]")
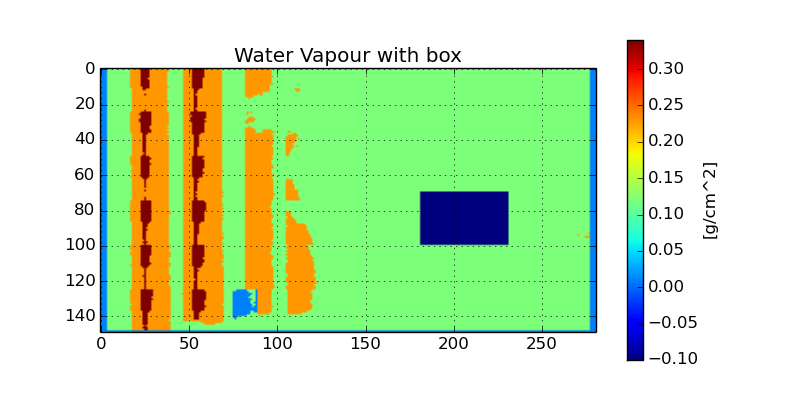
Modified water vapour content map with zeroed box
Of course values in the box that has been set to zero in the Dataset
are transformed according to the scaling factor and offset parameters
associated to water_vapour Band.
The complete code of the example can be found at
examples/update_elements.py.