

SimpleNorm#
- class astropy.visualization.SimpleNorm(stretch='linear', percent=None, *, min_percent=None, max_percent=None, vmin=None, vmax=None, power=1.0, log_a=1000, asinh_a=0.1, sinh_a=0.3, clip=False, invalid=-1.0)[source]#
Bases:
objectClass to create a normalization object that can be used for displaying images with Matplotlib.
This convenience class provides the most common image stretching functions. Additional stretch functions are available in
ImageNormalize.- Parameters:
- stretch{‘linear’, ‘sqrt’, :ref: ‘power’, log’, ‘asinh’, ‘sinh’}, optional
The stretch function to apply to the image. The default is ‘linear’.
- percent
python:float, optional The percentage of the image values used to determine the pixel values of the minimum and maximum cut levels. The lower cut level will set at the
(100 - percent) / 2percentile, while the upper cut level will be set at the(100 + percent) / 2percentile. The default is 100.0.percentis ignored if eithermin_percentormax_percentis input.- min_percent
python:float, optional The percentile value used to determine the pixel value of minimum cut level. The default is 0.0.
min_percentoverridespercent.- max_percent
python:float, optional The percentile value used to determine the pixel value of maximum cut level. The default is 100.0.
max_percentoverridespercent.- vmin
python:float, optional The pixel value of the minimum cut level. Data values less than
vminwill set tovminbefore stretching the image. The default is the image minimum.vminoverridesmin_percent.- vmax
python:float, optional The pixel value of the maximum cut level. Data values greater than
vmaxwill set tovmaxbefore stretching the image. The default is the image maximum.vmaxoverridesmax_percent.- power
python:float, optional The power index for
stretch='power'. The default is 1.0.- log_a
python:float, optional The log index for
stretch='log'. The default is 1000.- asinh_a
python:float, optional For
stretch='asinh', the value where the asinh curve transitions from linear to logarithmic behavior, expressed as a fraction of the normalized image. Must be in the range between 0 and 1. The default is 0.1.- sinh_a
python:float, optional The scaling parameter for
stretch='sinh'. The default is 0.3.- clipbool, optional
If
True, data values outside the [0:1] range are clipped to the [0:1] range.- invalid
python:Noneorpython:float, optional Value to assign NaN values generated by the normalization. NaNs in the input
dataarray are not changed. For matplotlib normalization, theinvalidvalue should map to the matplotlib colormap “under” value (i.e., any finite value < 0). IfNone, then NaN values are not replaced. This keyword has no effect ifclip=True.
See also
Examples
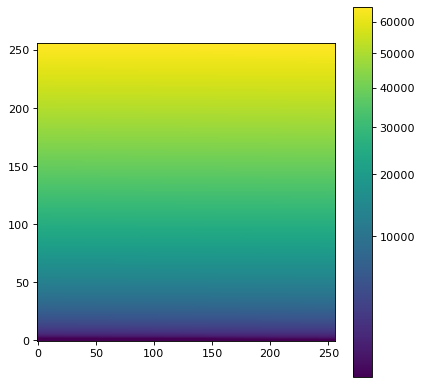
import numpy as np
import matplotlib.pyplot as plt
from astropy.visualization import SimpleNorm

image = np.arange(65536).reshape((256, 256))
snorm = SimpleNorm('sqrt', percent=98)
norm = snorm(image)
fig, ax = plt.subplots()
axim = ax.imshow(image, norm=norm, origin='lower')
fig.colorbar(axim)
Methods Summary
__call__(data)Return an
ImageNormalizeinstance that can be used for displaying images with Matplotlib.imshow(data[, ax])A convenience function to display an image using matplotlib's
matplotlib.pyplot.imshowfunction with the normalization defined by this class.Methods Documentation
- __call__(data)[source]#
Return an
ImageNormalizeinstance that can be used for displaying images with Matplotlib.- Parameters:
- data
ndarray The image array.
- data
- Returns:
- result
ImageNormalizeinstance An
ImageNormalizeinstance that can be used for displaying images with Matplotlib.
- result
- imshow(data, ax=None, **kwargs)[source]#
A convenience function to display an image using matplotlib’s
matplotlib.pyplot.imshowfunction with the normalization defined by this class.- Parameters:
- data2D or 3D numpy:array_like
The data to display. Can be whatever
imshowandImageNormalizeboth accept.- ax
python:NoneorAxes, optional The matplotlib axes on which to plot. If
None, then the currentAxesinstance is used.- **kwargs
python:dict, optional Keywords arguments passed to
imshow. Cannot include thenormorXkeyword.
- Returns:
- result
AxesImage The
AxesImagegenerated byimshow.
- result
Examples
import numpy as np
import matplotlib.pyplot as plt
from astropy.visualization import SimpleNorm

image = np.arange(65536).reshape((256, 256))
snorm = SimpleNorm('sqrt', percent=98)
fig, ax = plt.subplots()
axim = snorm.imshow(image, ax=ax, origin='lower')
fig.colorbar(axim)
