(42) Antarctica and stereographic data
In this example we demonstrate how one can use combine Cartesian data for Antarctica (here the BEDMAP data already projected via a stereographic projection) with geographic data, all using the same map scale. It also shows how one would set up minor legends and map scales.
#!/bin/bash
#               GMT EXAMPLE 42
#               $Id$
#
# Purpose:      Illustrate Antarctica and stereographic projection
# GMT modules:  makecpt, grdimage, pscoast, pslegend, psscale, pstext, psxy
# Unix progs:   [curl grdconvert]
#
ps=example_42.ps

gmt set FONT_ANNOT_PRIMARY 12p FONT_LABEL 12p PROJ_ELLIPSOID WGS-84 FORMAT_GEO_MAP dddF
# Data obtained via website and converted to netCDF thus:
# curl http://www.antarctica.ac.uk//bas_research/data/access/bedmap/download/bedelev.asc.gz
# gunzip bedelev.asc.gz
# grdconvert bedelev.asc BEDMAP_elevation.nc=ns -V
gmt makecpt -Cearth -T-7000/4000 > z.cpt
gmt grdimage -Cz.cpt BEDMAP_elevation.nc -Jx1:60000000 -Q -P -K > $ps
gmt pscoast -R-180/180/-90/-60 -Js0/-90/-71/1:60000000 -Bafg -Di -W0.25p -O -K >> $ps
gmt psscale -Cz.cpt -DJRM+w2.5i/0.2i+o0.5i/0+mc -R -J -O -K -F+p+i -Bxa1000+lELEVATION -By+lm >> $ps
# GSHHG
gmt pscoast -R -J -Di -Glightblue -Sroyalblue2 -O -K -X2i -Y4.75i >> $ps
gmt pscoast -R -J -Di -Glightbrown -O -K -A+ag -Bafg >> $ps
gmt pslegend -DjLM+w1.7i+jRM+o0.5i/0 -R -J -O -K -F+p+i << EOF >> $ps
H 18 Times-Roman Legend
D 0.1i 1p
S 0.15i s 0.2i blue  0.25p 0.3i Ocean
S 0.15i s 0.2i lightblue  0.25p 0.3i Ice front
S 0.15i s 0.2i lightbrown  0.25p 0.3i Grounding line
EOF
# Fancy line
gmt psxy -R0/7.5/0/10 -Jx1i -O -K -B0 -W2p -X-2.5i -Y-5.25i << EOF >> $ps
0	5.55
2.5	5.55
5.0	4.55
7.5	4.55
EOF
gmt pstext -R -J -O -F+f18p+jBL -Dj0.1i/0 << EOF >> $ps
0 5.2 BEDMAP
0 9.65 GSHHG
EOF
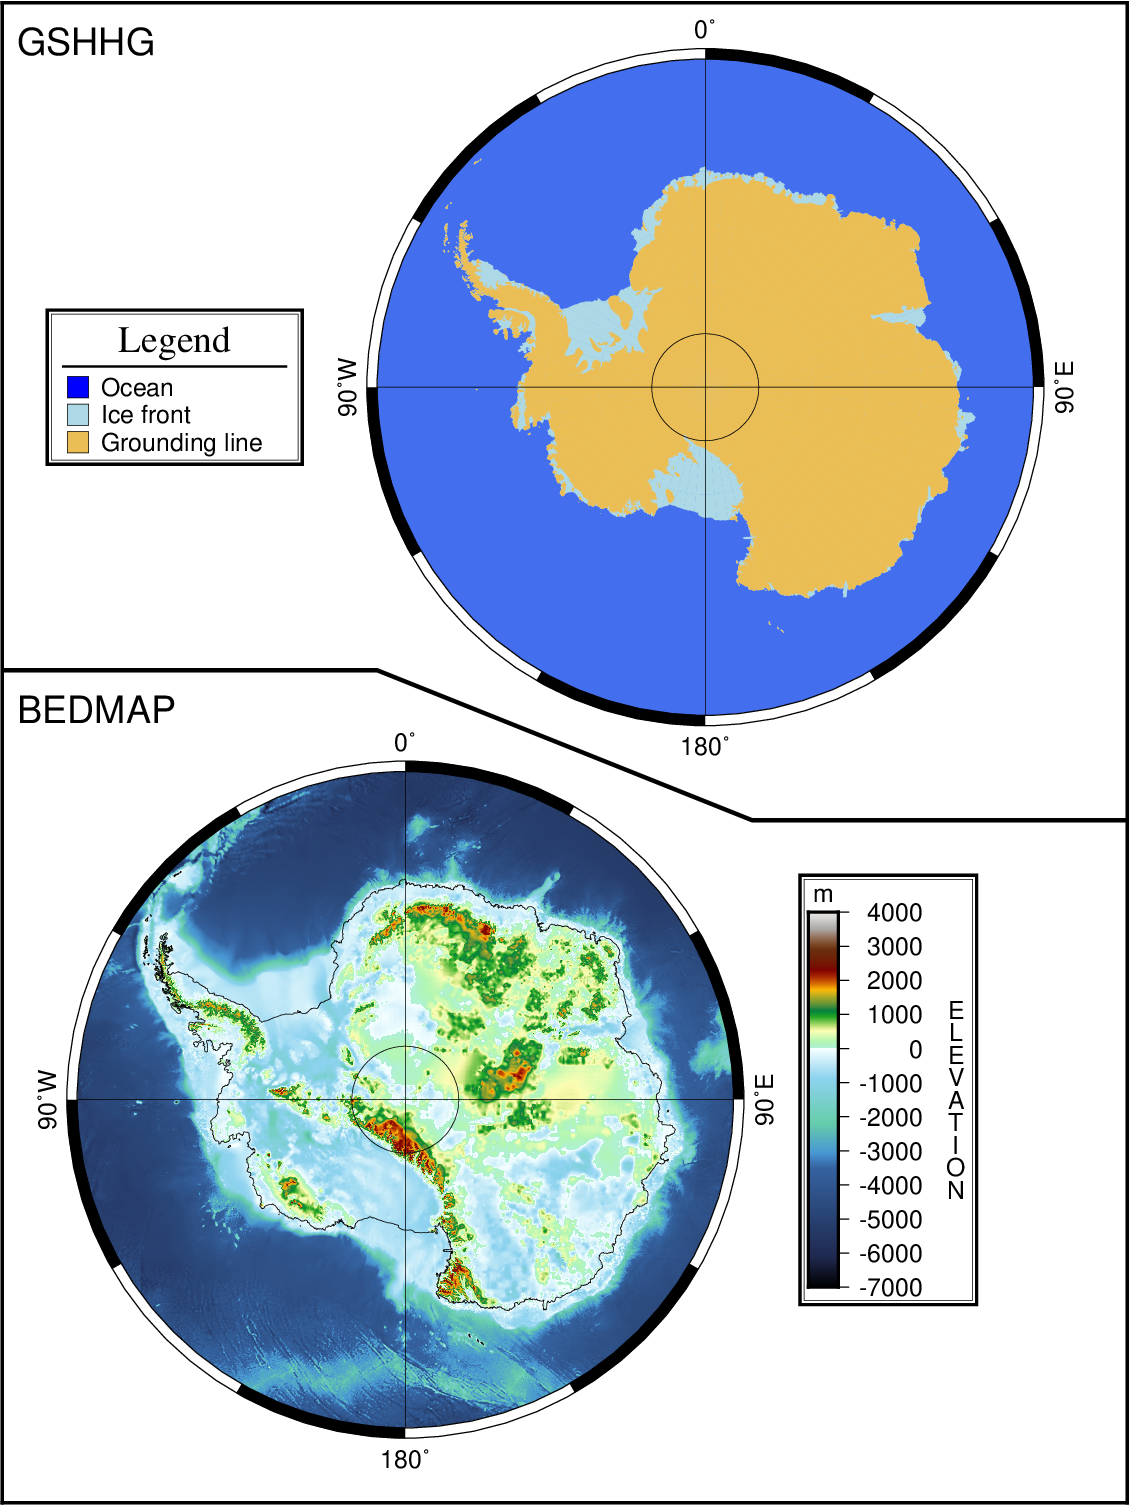
Illustrate plotting of Antarctica with Stereographic Data.